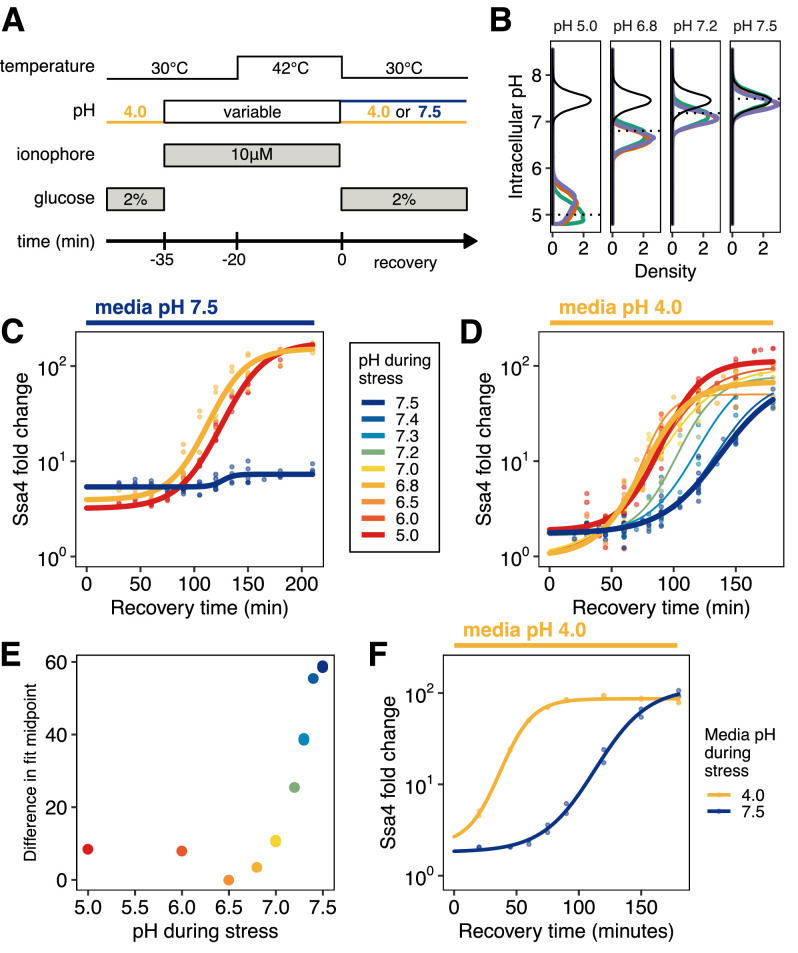
Figure 4. Quantitative control of intracellular pH reveals that, in the absence of translation, acidification is required for Ssa4 induction.
(A) Schematic of intracellular pH manipulation experiments. (B) Intracellular pH is accurately manipulated during stress. Intracellular pH distributions were measured to determine the efficacy of pH manipulation before (green), during (red), and after (purple) 42°C heat stress. Dashed lines indicate buffer pH, and the black distribution shows unmanipulated cells for comparison. (C) Manipulation of intracellular pH with ionophore reproduces the acidification-dependent induction of Ssa4. Compare to Figure 2B, right hand side. (D) Fold change in Ssa4 expression following stress at different intracellular pHs and recovery in acidic media. Points represent the median of individual measurements; at least three biological replicates were performed for each condition (see Materials and methods). Lines are sigmoid fits (see Materials and methods for fitting details). (E) pH dependence of the induction delay; points are the midpoint of the sigmoidal fits in D. (F) Dependence of the stress response on media pH, followed by recovery in acidic media, recapitulates the pH dependence of the stress response when ionophore treatment is used; compare to D.


