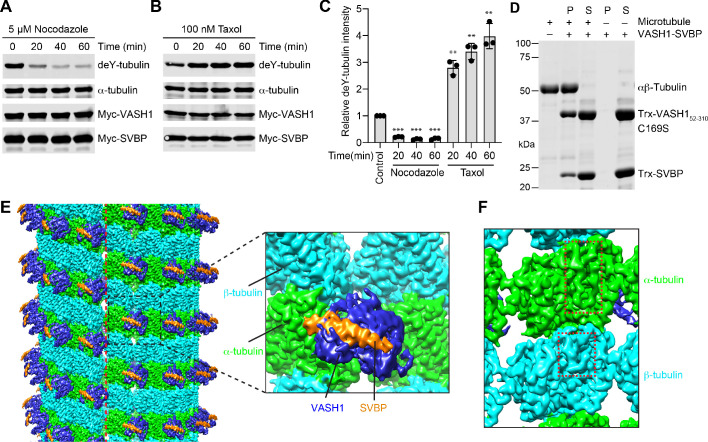
Figure 1. VASH1-SVBP efficiently detyrosinates and binds microtubules.
(A,B) Tubulin detyrosination assays of VASH1-SVBP in human cells. HeLa Tet-On cells were co-transfected with VASH1 and SVBP plasmids, and treated with 5 µM nocodazole (A) or 100 nM Taxol (B) for indicated times at 24 hr post-transfection. The cell lysates were blotted with the indicated antibodies. deY-tubulin, detyrosinated α-tubulin. Experiments were repeated three times with similar results. (C) Quantification of the relative detyrosination levels of α-tubulin in (A) and (B) (mean ± s.d., n = 3 independent experiments). Significance calculated using two-tailed student’s t-test; between control cells and cells treated with nocodazole or Taxol for the indicated time; *p < 0.05, **p < 0.01, ***p < 0.001, and ****p < 0.0001. (D) Microtubule pelleting assays showing the binding of VASH1-SVBP to recombinant human microtubules. S, supernatant; P, pellet. (E) Cryo-EM map of 14-protofilament, GMPCPP-stabilized microtubules decorated by the VASH152-310-SVBP complex. The catalytically inactive C169S mutant of VASH1 was used in the complex. The map is lowpass filtered to 4 Å. The microtubule seam is indicated by a red dashed line. α-tubulin, β-tubulin, VASH1, and SVBP are colored in green, cyan, blue, and orange, respectively. The same color scheme is used for all figures. The inset shows a close-up view of the boxed region. (F) Close-up view of the cryo-EM map in (E), viewed from the lumen. The α- and β-tubulin molecules can be distinguished by the length of the S9-S10 loop (boxed with red dashed lines), with the loop in α-tubulin being longer.


