. 2020 Aug 26;9:e57757. doi: 10.7554/eLife.57757

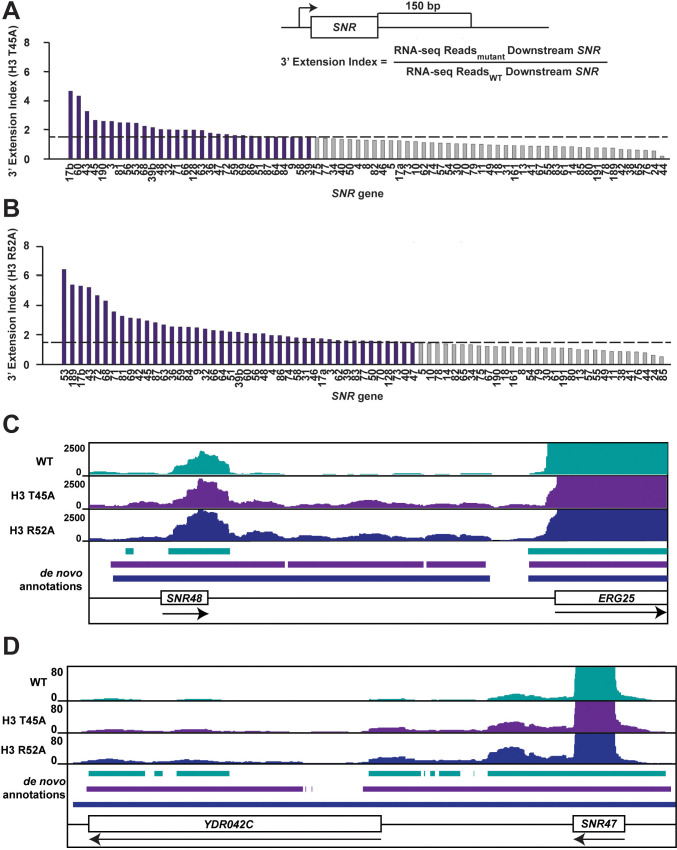
Figure 2. Mutations that alter the nucleosome DNA entry-exit site cause widespread 3’ extension of snoRNAs.

(A, B) 3’ extension index in (A) the H3 T45A mutant and (B) the H3 R52A mutant. The ratio (mutant/WT) of spike-in normalized RNA-seq read counts between mutant and wild-type strains produced by plasmid shuffling of strain KY812 was determined in a window 150 bp downstream of each annotated snoRNA 3’ end. Ratios equal to or greater than 1.5 (dotted line) are highlighted in purple. (C, D) Browser tracks visualized in IGV (Thorvaldsdóttir et al., 2013) showing de novo transcript annotations across (C) the SNR48 locus and (D) the SNR47 locus. The browser tracks represent spike-in normalized RNA-seq reads in a wild-type strain and the H3 T45A and H3 R52A mutants. Lines of matching color beneath correspond to the de novo transcript annotations for each dataset. Arrows below gene names indicate directionality of transcription.

Figure 2—source data 1. SNR gene 3' extension index RNA-seq data.

Figure 2.

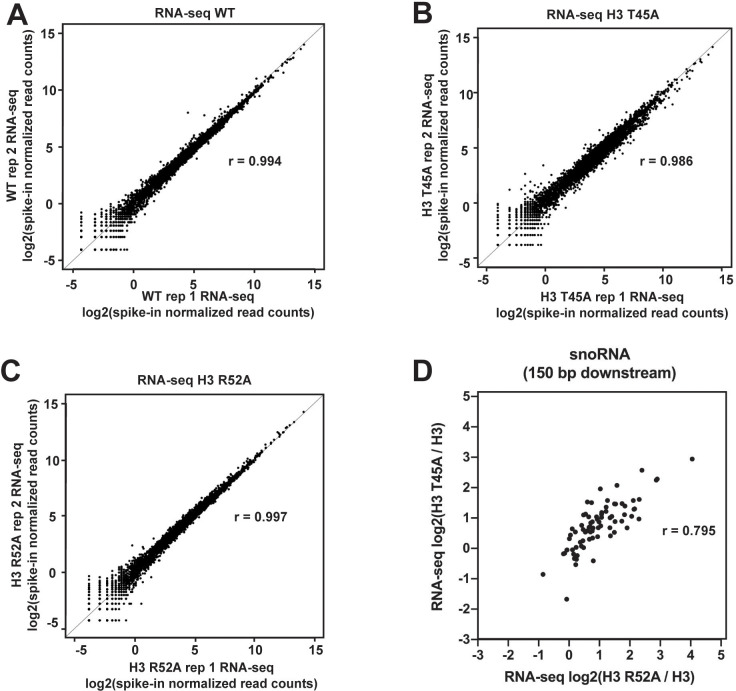
Figure 2—figure supplement 1. Agreement between biological replicates of RNA-seq datasets.

Figure 2—figure supplement 1.

(A–C) Biplots showing agreement between biological replicates of RNA-seq data for (A) WT, (B) the H3 T45A mutant, and (C) the H3 R52A mutant. Log2-transformed, spike-in normalized RNA-seq read counts were calculated for protein-coding genes and plotted for each mutant and WT. For each pair of biological replicates Pearsons correlation (r) is indicated. (D) Scatter plot of log2(H3 T45A/H3) versus log2(H3 R52A/H3) of strand-specific, spike-in normalized read counts 150 bp downstream of the snoRNA genes.
Figure 2—figure supplement 2. Levels of the Nrd1-unterminated transcripts (NUTs) change in DNA entry-exit site mutants.
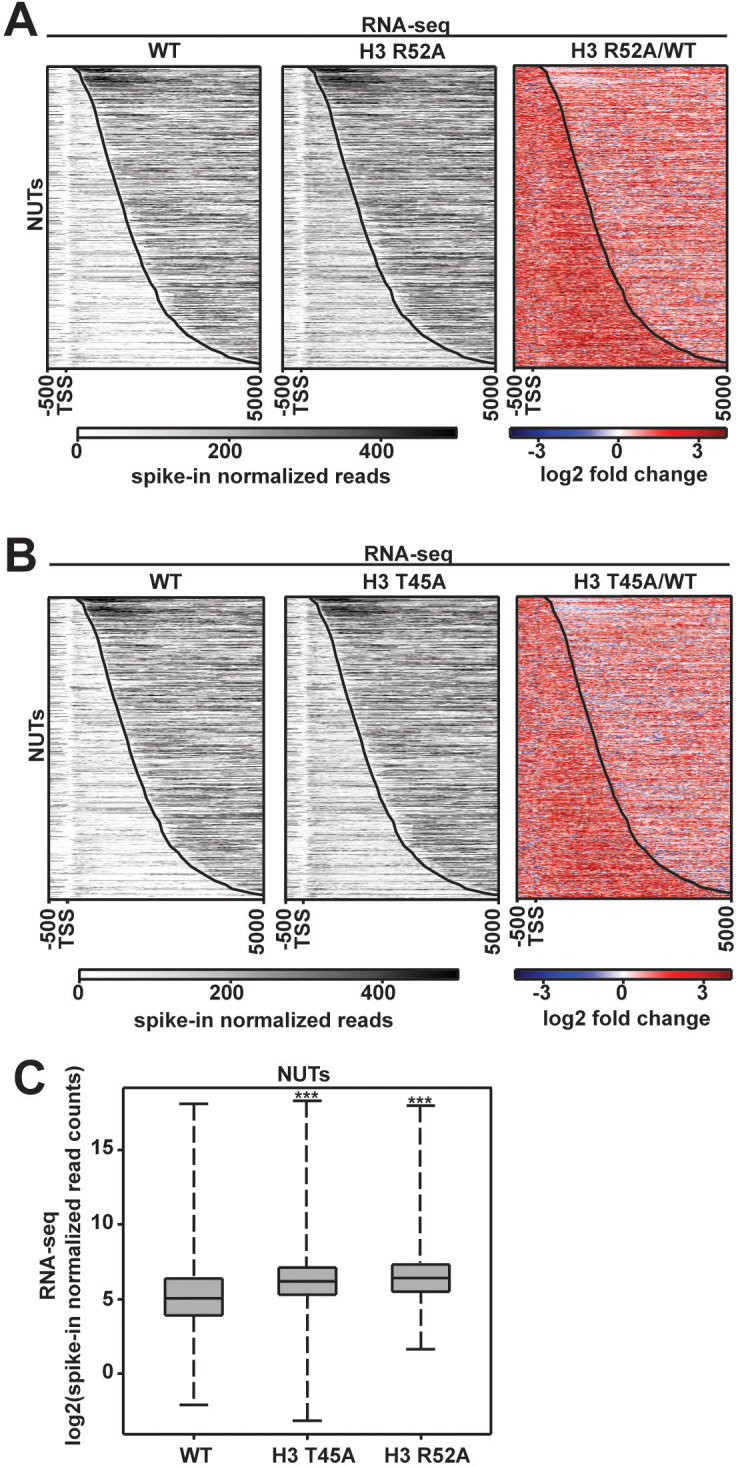
Figure 2—figure supplement 2.

(A, B) RNA-seq analysis of annotated NUTs (Schulz et al., 2013) in WT, H3 R52A and H3 T45A strains. Gray scale profiles show spike-in normalized data. Tri-color heatmaps show log2-fold change between mutant and the wild type. All heatmaps, made in deepTools2 (Ramírez et al., 2014; Ramírez et al., 2016), show the region from −500 bp to +5000 bp relative to the annotated TSS of the NUTs. The curved black line indicates the TES. (C) Box and whisker plots graphing spike-in normalized read counts for RNA-seq data over NUT annotations. Boxplots were generated using deepTools2 (Ramírez et al., 2014; Ramírez et al., 2016) and R Studio (RStudio Team, 2016) and show the full range of data in the sample indicated (whisker length). Statistical significance was assigned using the Wilcoxon ranked sums test (***p<0.001).