. 2020 Aug 26;9:e57757. doi: 10.7554/eLife.57757

Figure 6. Mutation of the DNA entry-exit site alters nucleosomes genome-wide.

(A) Heatmap of the log2-fold change of MNase-seq read counts (spike-in normalized as described in Materials and methods) of the H3 R52A mutant relative to WT. Rows represent 6205 protein-coding genes (as in Figure 3) sorted by length and showing 500 bp upstream of the +1 nucleosome (Brogaard et al., 2012) and 500 bp downstream of the CPS (curved black dotted line; Ozsolak et al., 2010). (B) Violin plot of log2-transformed normalized read counts from MNase-seq data in the region 150 bp downstream of the CPS. The difference between WT and the H3 R52A mutant is statistically significant (p<0.0001) as determined by a Wilcoxon rank-sum test. (C) Metagene plots showing normalized MNase-seq read counts for WT (black) and the H3 R52A mutant (purple) in a region from −500 bp to +1000 bp relative to the +1 nucleosome. (D) MNase-seq metagene plots as in C, but plotted from −1000 bp to +500 bp from the CPS. (E) Metagene plots showing spike-in normalized FLAG-Rpb3 ChIP-seq read counts for wild-type (gray) and the H3 R52A mutant (blue) in a region from −500 bp to +500 bp relative to the CPS (Ozsolak et al., 2010). All heatmaps and metagene plots were generated using deepTools2 (Ramírez et al., 2014; Ramírez et al., 2016) using 25 bp bins and 6205 protein-coding genes. All MNase-seq data were produced using a 2.5 U MNase digestion. (F) Heatmaps of MNase-seq, RNA-seq and 4tU-seq data sorted (lowest to highest log2 fold change value based on the MNase-seq data) by mean row value in the MNase-seq data and centered on the CPS and extending up- and downstream by 500 bp. Rows in panel F represent 2879 protein-coding genes present on chrIV, chrVII, chrXII, chrXIV and chrXV (no evidence of aneuploidy in any genomic\transcriptomic dataset for the H3 R52A mutant).

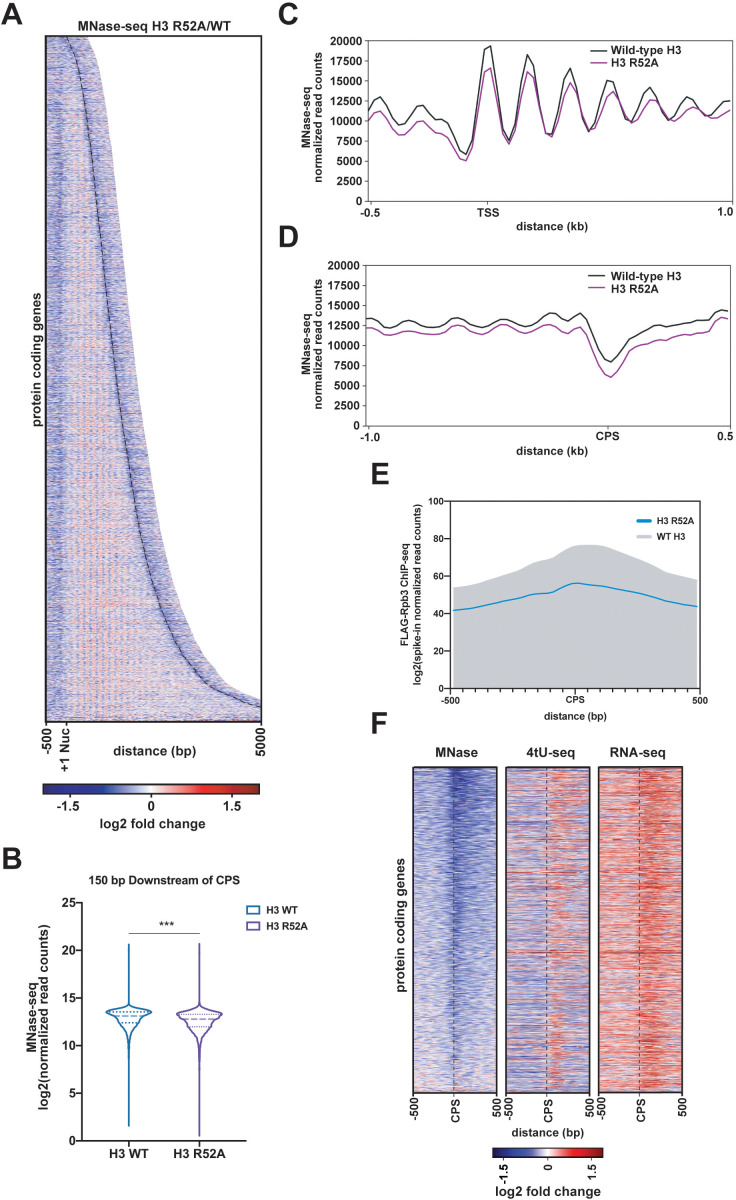
Figure 6.

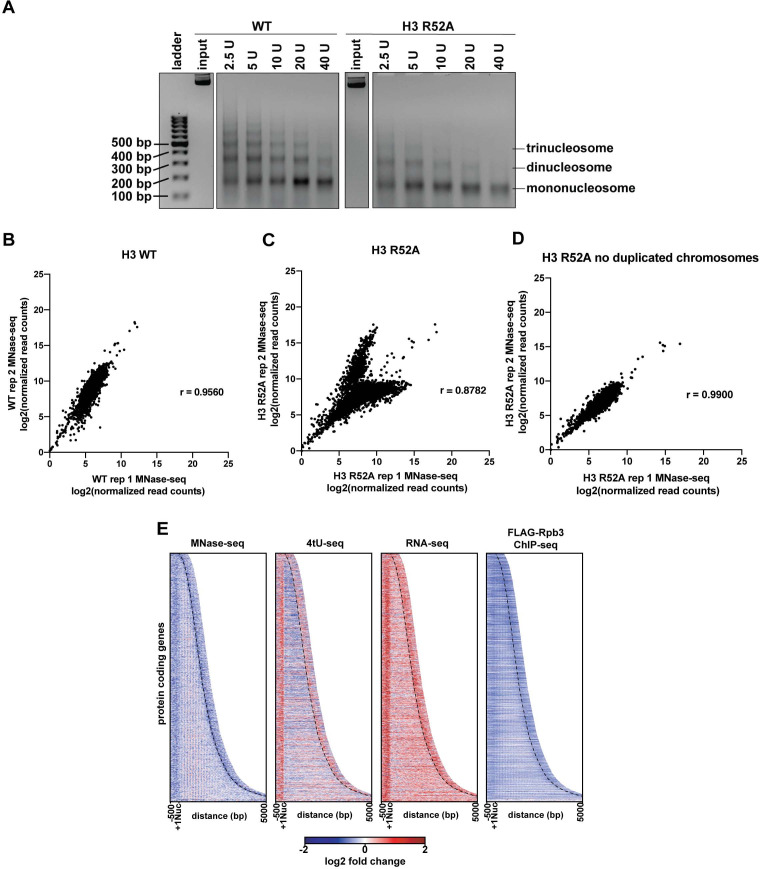
Figure 6—figure supplement 1. Analysis of MNase digestion and MNase-seq data for the the H3 R52A mutant.

Figure 6—figure supplement 1.

(A) Ethidium bromide stained agarose gel of MNase-treated chromatin with the indicated amounts of MNase. Input indicates untreated chromatin. Mono- and poly-nucleosome species are indicated. (B, C) Biplots showing agreement between biological replicates. Log2-transformed, spike-in normalized MNase-seq read counts (see Materials and methods) were calculated for protein-coding genes and plotted with Prism 8. Pearson’s correlation coefficients were calculated for each pair of biological replicates. (D) Biplot as in C but showing MNase-seq read counts over regions encoding mRNAs (4448 genes) on chromosomes with no evidence of aneuploidy in either replicate of the MNase-seq data for the H3 R52A strain (chrII, chrIV, chrIX, chrV, chrVI, chrVII, chrXII, chrXIII, chrXIV and chrXV). (E) Heatmaps of the log2-fold ratio of normalized MNase-seq, 4tU-seq, RNA-seq, and FLAG-Rpb3 ChIP seq read counts of the H3 R52A mutant relative to WT. Rows represent 2879 protein-coding genes present on chrIV, chrVII, chrXII, chrXIV and chrXV (no evidence of aneuploidy in any genomic/transcriptomic dataset) sorted by length and showing 500 bp upstream of the +1 nucleosome (Brogaard et al., 2012) and 500 bp downstream of the CPS (curved black dotted line) (Ozsolak et al., 2010).
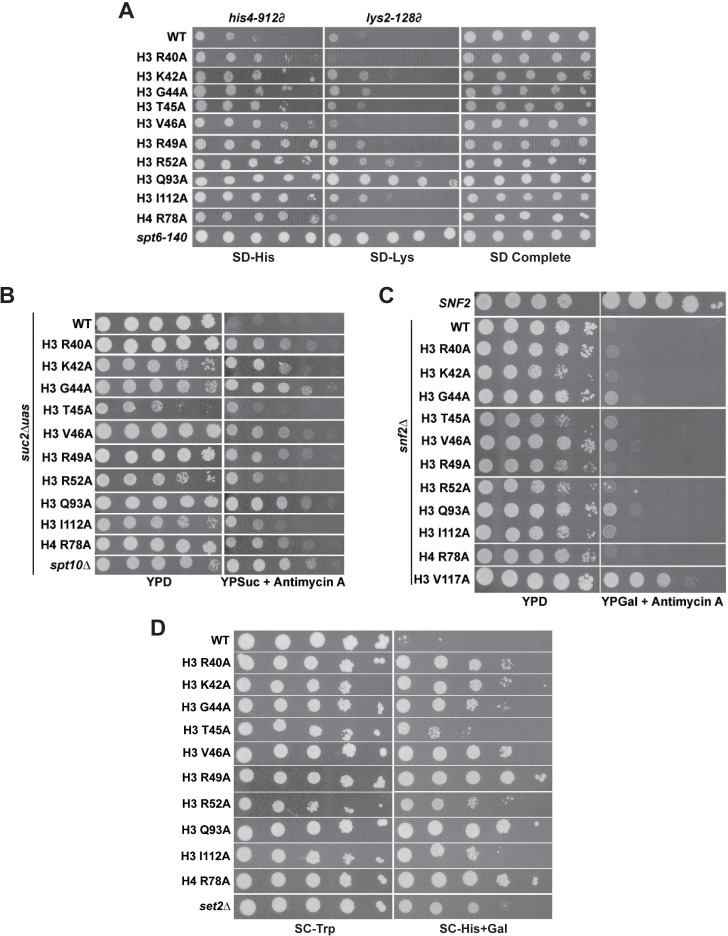
Figure 6—figure supplement 2. DNA entry-exit site mutants exhibit chromatin- and transcription-related phenotypes.

Figure 6—figure supplement 2.

(A) The Spt- phenotype was assessed at two Ty ∂ element insertion mutations, his4-912∂ and lys2-18∂, using a five-fold serial dilution series of a yeast culture starting at OD600 = 0.8. Histone mutant plasmids (TRP1-marked, CEN/ARS) were transformed into KY3502 for plasmid shuffling. The positive control was spt6-140 (KY319). SD complete was used as a growth control and SD-His and SD-Lys were used to assess the Spt- phenotype. Plates were incubated at 30°C for 5 days. (B) The Bur- phenotype was assessed in a suc2∆uas(−1900 /- 390) strain (KY3503) by five-fold serial dilution of a culture starting at OD600 = 0.8. Histone mutant plasmids (TRP1-marked, CEN/ARS) were transformed into KY3503 for plasmid shuffling. The positive control was spt10∆ (KY325). Cells were grown on YPD as a growth control and on YPSucrose + 1 µg/mL antimycin A to score the Bur- phenotype. Plates were incubated at 30°C for 4 days. (C) The Sin- phenotype was assessed in a snf2∆ strain (KY3354) by ten-fold serial dilution of a culture starting at 1 × 10⁸ cells/mL. Histone mutant plasmids (TRP1-marked, CEN/ARS) were transformed into KY3354 for plasmid shuffling. The positive control was the H3 V117A mutant (Hainer and Martens, 2011). Cells were grown on YPD as a growth control and on YPGalactose + 1 µg/mL antimycin A to score the Sin- phenotype. Plates were incubated at 30°C for 3 days. (D) The cryptic initiation phenotype was assessed in a GAL1pr:FLO8::HIS3 reporter strain (KY3506) by ten-fold serial dilution of a culture starting at OD600 = 0.8 and plating on selective media. Histone mutant plasmids (TRP1-marked, CEN/ARS) were transformed into KY3506 for plasmid shuffling. The positive control was a set2∆ strain. Cells were grown on SC-Trp as a growth control and on SC-His+Gal to score cryptic initiation. Plates were incubated at 30°C for 4 days.