. 2020 Aug 3;9:e58246. doi: 10.7554/eLife.58246

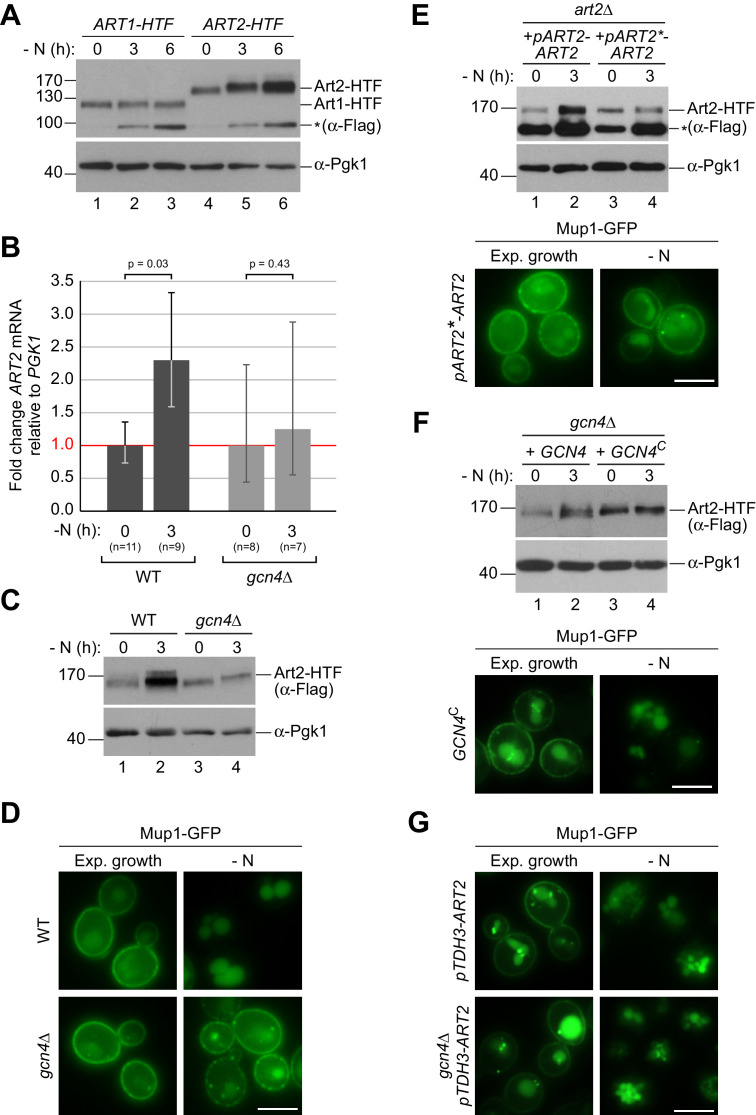
Figure 4. The general amino acid control pathway promotes starvation-induced endocytosis Mup1 by up-regulating Art2.

(A) SDS PAGE and western blot analysis with the indicated antibodies of whole cell protein extracts from WT cells expressing ART1-HTF or ART2-HTF. Cells were starved (- N) for the indicated times after 24 hr exponential growth. The asterisk indicates a non-specific background band of the FLAG antibody. Quantification in Figure 4—figure supplement 1B. (B) RT-qPCR analysis of ART2 transcript levels (normalized to the stable PGK1 transcript) in wild type (WT) and gcn4∆ cells. Cells were starved (- N) for 3 hr after 24 hr exponential growth. Values are presented as fold-change of the starting values (t = 0). Error bars represent the standard deviation. Statistical significance was assessed by Student’s t-test. (C) SDS PAGE and western blot analysis with the indicated antibodies of whole cell protein extracts from the indicated strains expressing ART2-HTF. Cells were starved (- N) for 3 hr after 24 hr exponential growth. Quantification in Figure 4—figure supplement 1C. (D) Live-cell fluorescence microscopy analysis of the indicated strains expressing MUP1-GFP from plasmid. Cells were starved (- N) for 6 hr after 24 hr exponential growth. (E), (F) The indicated strains were analyzed as in C) (upper panels) and D) (lower panels). Quantification of western blots in Figure 4—figure supplement 1F,G. (G) Live-cell fluorescence microscopy analysis of art2∆ or gcn4∆ cells expressing pRS415-MUP1-GFP and pRS416-pTDH3-ART2 starved (- N) for 6 hr after 24 hr exponential growth. Scale bars = 5 µm. See also Figure 4—figure supplements 1 and 2.

Figure 4.

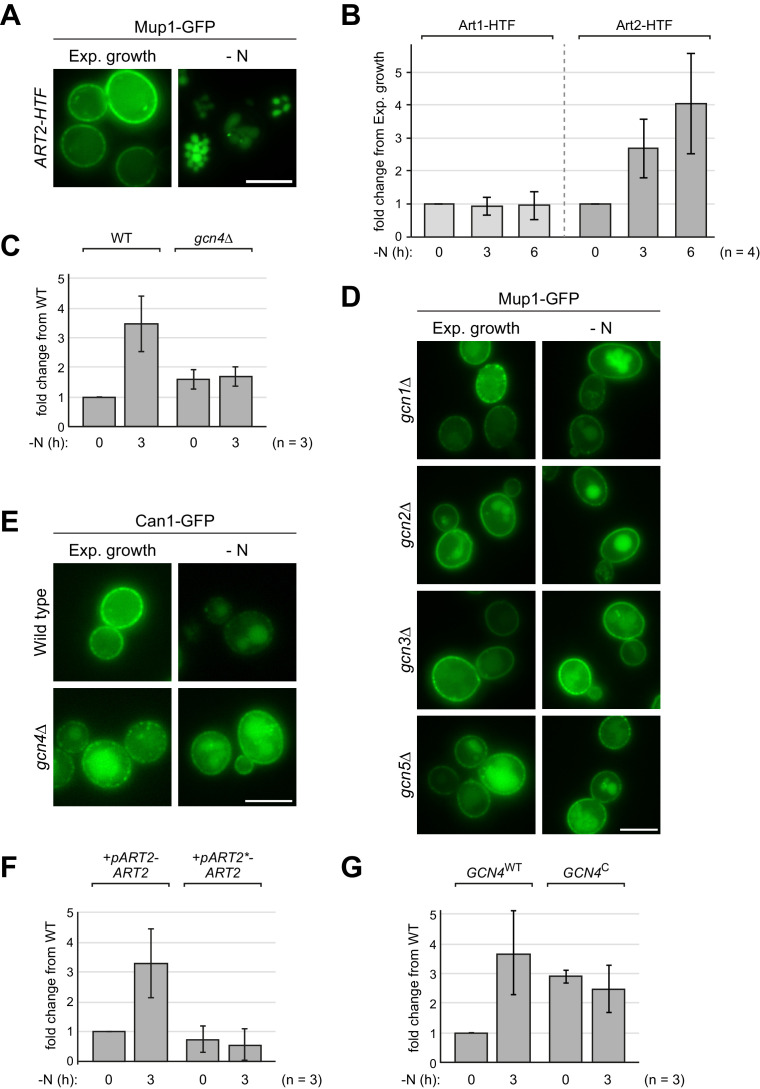
Figure 4—figure supplement 1. The general amino acid control pathway promotes starvation-induced endocytosis Mup1 by up-regulating Art2 – supporting experiments and quantifications.

Figure 4—figure supplement 1.

(A) Live-cell fluorescence microscopy analysis of WT cells expressing chromosomally 6xHis-TEV-3xFLAG-tagged ART2 (ART2-HTF) and MUP1-GFP starved (- N) for 6 hr after 24 hr exponential growth. (B) Densitometric quantification of Art1-HTF and Art2-HTF protein levels in Figure 4A. Data were normalized to Pgk1 loading control and presented as fold-change from expression in exponential growth (0 hr) (mean ± standard deviation from n = 4 independent experiments). (C) Densitometric quantification of Art2-HTF protein levels in Figure 4C. Data were normalized to Pgk1 loading control and presented as fold-change in expression from WT in exponential growth (0 hr) (mean ± standard deviation from n = 3 independent experiments). (D), (E) Live-cell fluorescence microscopy analysis of the indicated strains starved (- N) for 6 hr after 24 hr exponential growth. (F), (G) Densitometric quantification of Art2-HTF protein levels in Figure 4E and F analyzed as in C). Scale bars = 5 µm.
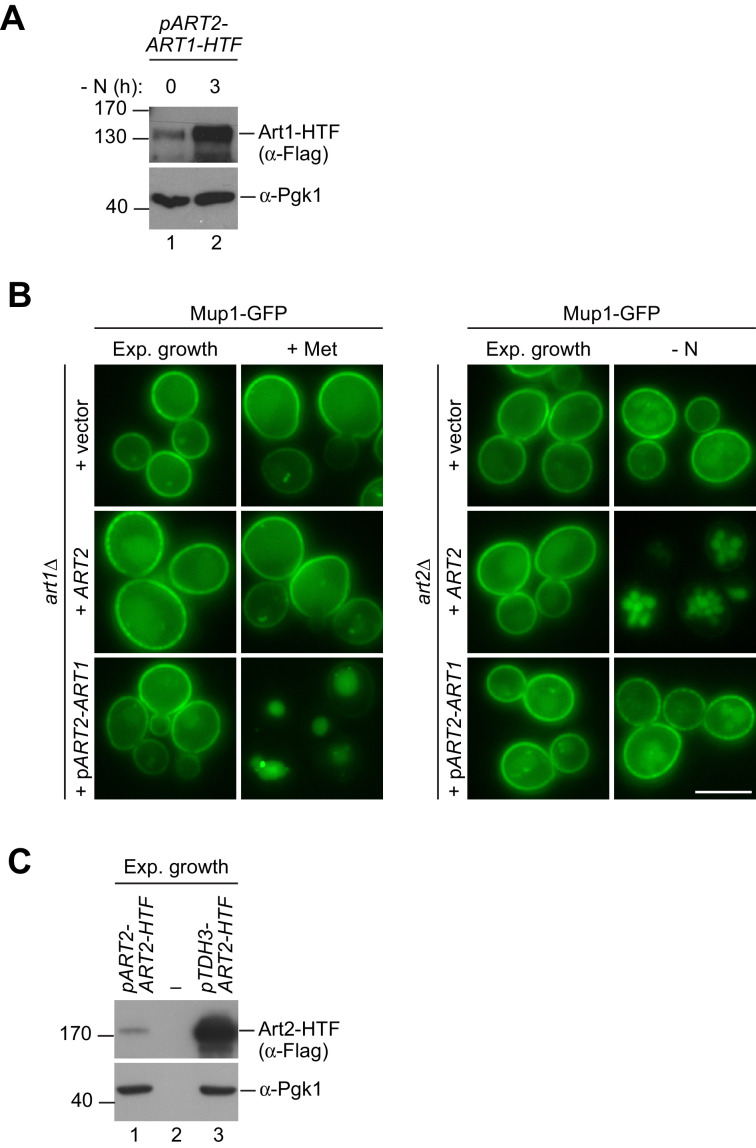
Figure 4—figure supplement 2. Upregulation of Art1 cannot substitute Art2 in starvation-induced endocytosis of Mup1.

Figure 4—figure supplement 2.

(A) SDS PAGE and western blot analysis with the indicated antibodies of whole cell protein extracts from art2∆ cells expressing pRS416-pART2-ART1-HTF starved (- N) for 3 hr after 24 hr exponential growth. (B) Live-cell fluorescence microscopy analysis of art1∆ and art2∆ cells expressing MUP1-GFP and the indicated plasmids. Cells were treated with 20 µg/ml L-methionine (+ Met) for 1.5 hr or starved (- N) for 6 hr after 24 hr exponential growth. (C) SDS PAGE and western blot analysis with the indicated antibodies of whole cell protein extracts from WT cells expressing pART2-ART2-HTF or pRS416-pTDH3-ART2-HTF after 24 hr exponential growth. Scale bars = 5 µm.