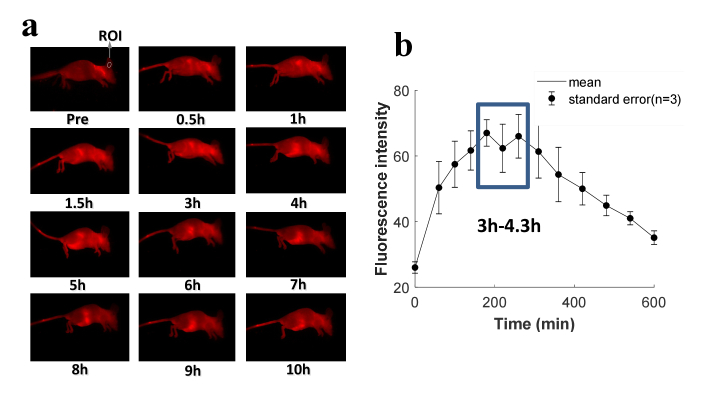
Fig. 2.
The fluorescence imaging of PS biodistribution. (a) Images of BPD distribution in mice at different time points. The white circle shows the region of interest (ROI) in the mouse ear used for fluorescence intensity quantification. (b) Fluorescence intensity of BPD at ear region as a function of time.

