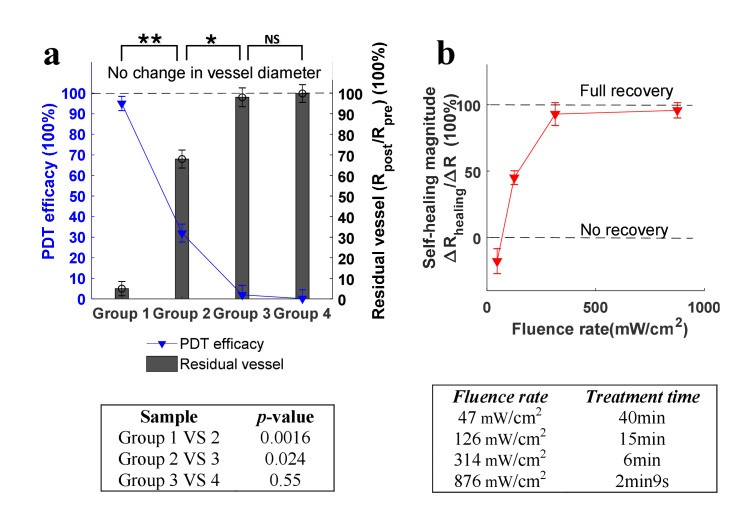
Fig. 7.
Quantitative analysis of PDT responses after 15 days of treatment (a) Permanent vascular change and PDT efficacy as a function of fluence rate (vascular destruction at day 15 post PDT was considered permanent). Blue line: the efficacy of PDT. Histogram: the residual vessel in diameter, quantified by Rpost/Rpre. Error bars: standard deviation (from 3 sets of random sampling statistics, each sampling contains 10 random positions in treated ear region). , p<0.05; , p<0.01; NS, not significant. The table below shows the specific p-values between groups, indicating the statistical difference. The PDT efficacy (ΔR/Rpre) and the residual vessel (Rpost/Rpre) have the same p-value results. (b) Self-healing magnitude as a function of PDT fluence rate based on the results of day 15 Post-PDT. Total light dose (fluence rate times treatment time) was maintained at a constant (113 J/cm2), as shown by the table below. Error bars: standard deviation.

