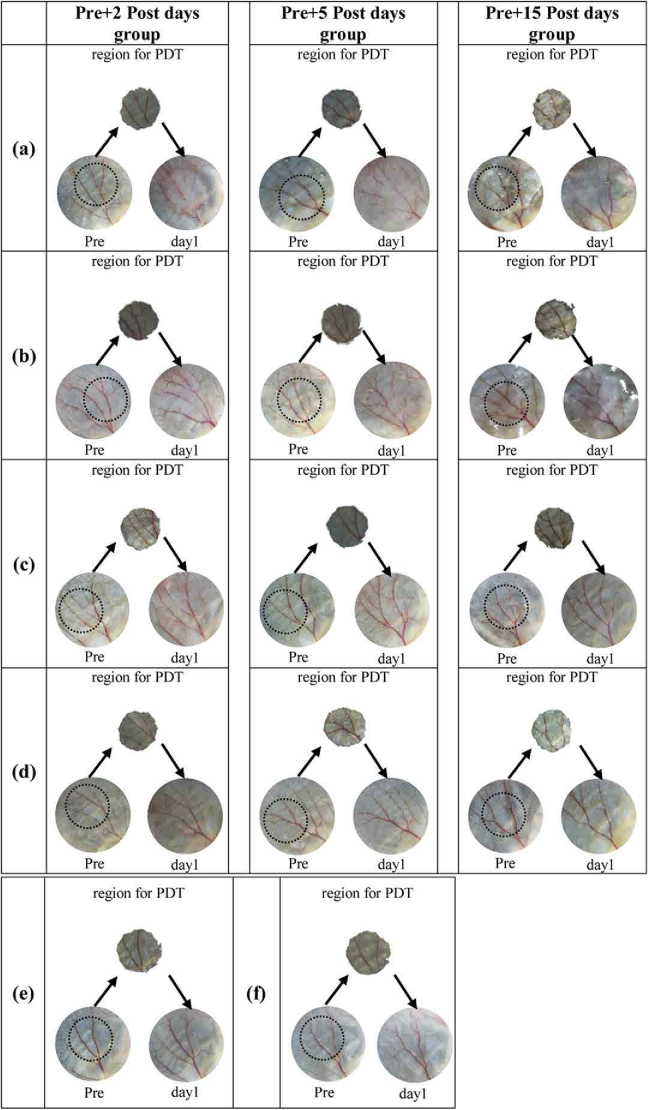
Fig. 8.
The ear region for PDT irradiation characterized by photograph for all mice used in this study. The photographs of Pre condition, treatment region and day 1 post-PDT are shown for each mouse to verify the treatment area, where the round black circle in Pre-condition indicates the region for PDT irradiation, and matches the tape hole area (region for PDT).(a) PDT group 1 (fluence rate of 47 mW/cm2) (b) PDT group 2 (fluence rate of 126 mW/cm2); (c) PDT group 3 (fluence rate of 314 mW/cm2); (d) PDT group 4 (fluence rate of 876 mW/cm2). Each PDT group has three mice for statistical analysis, corresponding to three observing periods, including 2 days, 5 days and 15 days post PDT. (e) Control group 1 (mice treated with only light); (f) Control group 2 (mice treated with only PS).

