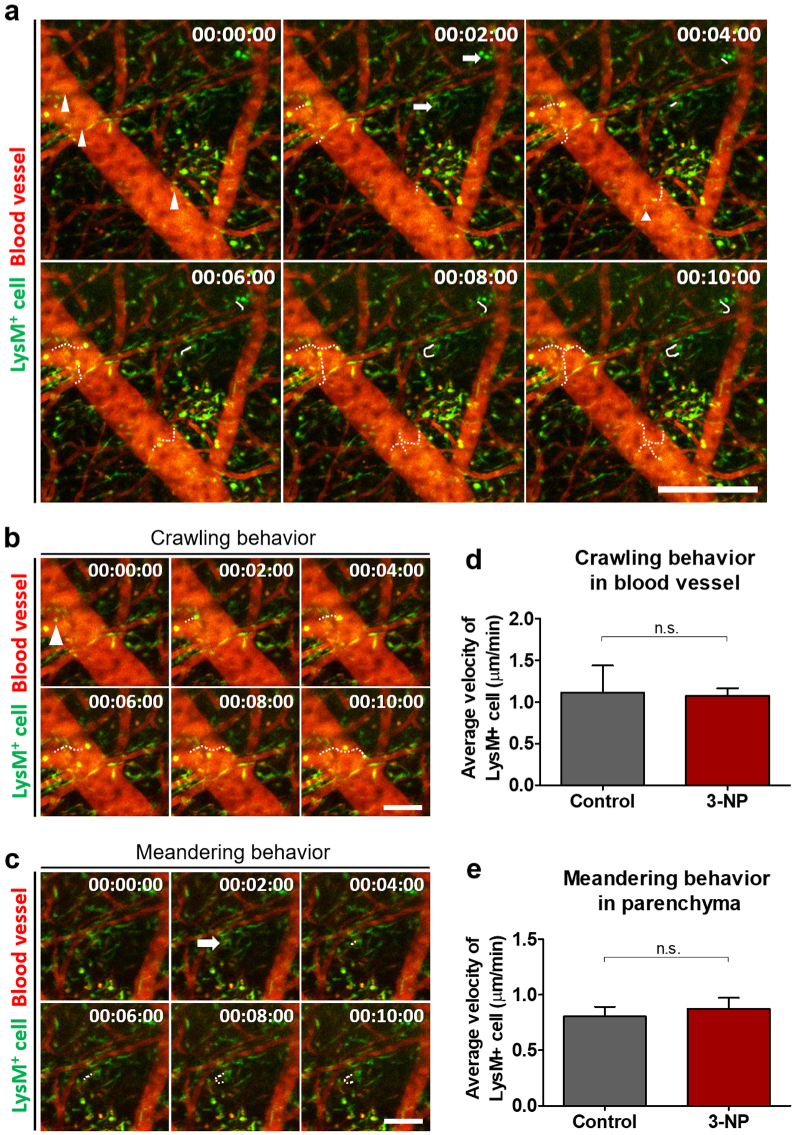
Fig. 3.
(a) Time-lapse images obtained from the brain of the LysM-GFP mouse in vivo at 10 days after the 3-NP injection (green, LysM-GFP+ ; red, blood vessel labelled by TRITC-dextran). LysM+ cells showed an intravascular crawling behavior (arrowhead) and a meandering behavior (arrow) in the parenchyma. (b) Serial images showing the crawling behavior of the LysM+ cells along the blood vessel walls. (c) Serial images showing the meandering behavior of the LysM+ cells infiltrated into the parenchyma. (d) Average velocity of the crawling LysM+ cells in the blood vessels (n = 4 field of views from 2 mice). (e) Average velocity of the meandering LysM+ cells in the parenchyma (n = 4 field of views from 2 mice). Scale bars = (a) 250 μm, (b, c) 100 μm.

