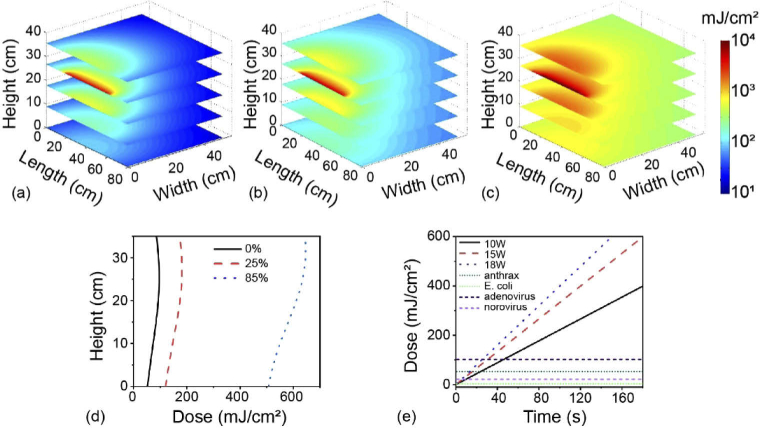
Fig. 3.
Cumulative UV-C dose delivered for a three minute exposure inside the UV-C disinfection system. Three different wall reflectivity values are modeled: (a) 0%, (b) 25%, and (c) 85%. (d) The dose at different heights for all three reflectivities modeled, measured in the centered of the box x-y plane (e) Dose as a function of time for three different UV-C source powers. This calculation is performed at the center of the bottom of the enclosure. The specific coordinate based on the schematic in Fig. 2 is (39.4, 25.4, 0). For comparison, the requisite doses to achieve three log reduction in growth for two bacteria and two viruses are also plotted [17–20].

