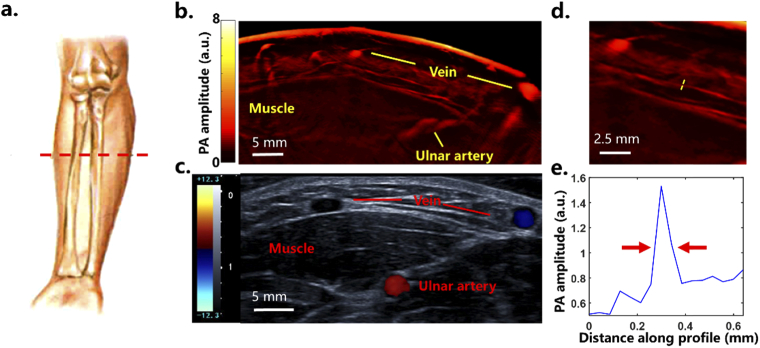
Fig. 2.
Imaging location and corresponding PAT and US images. (a) Netter’s anatomy of human forearm showing the imaging location, indicated by a red dashed line. (b) Cross-sectional PAT image of the imaging location. a.u.=arbitrary unit (c) Corresponding US image of the same location. (d) One small vessel was selected (yellow dashed line) to measure the PAT resolution. (e) Photoacoustic signal profile along the yellow dashed line showing the full width at half maximum to be about 150 µm.

