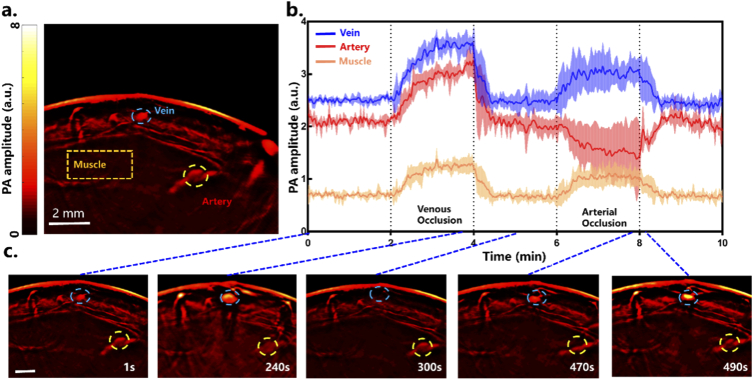
Fig. 3.
Dynamic changes within the cross-sectional PA images during the trial. (a) Reference PAT image at 800 nm where three regions of interest (ROIs) were selected. (b) Temporal PA signal trace during the occlusion trial (reported as mean ± SD). (c) A series of close-up PAT images at different time points show the dimensional changes of a vein and the ulnar artery. a.u.=arbitrary unit

