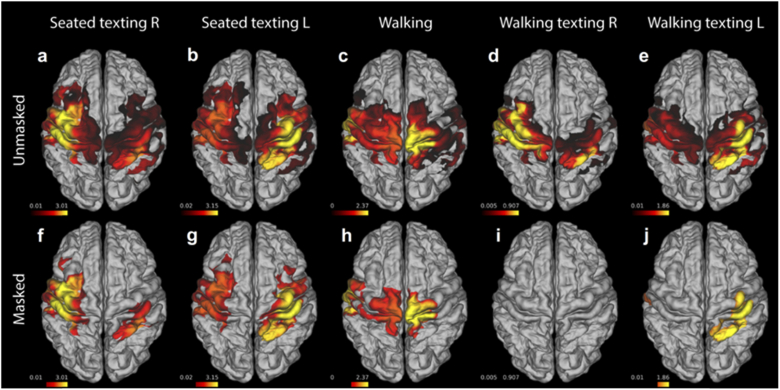
Fig. 4.
Group T-stat maps for the contrast of task ΔHbO > baseline ΔHbO for each of the five conditions. The upper row (a-e) consists of the unmasked T-statistic maps, while the lower row (f-j) shows the masked T-stat maps in which only values that remain significant after correction are displayed.

