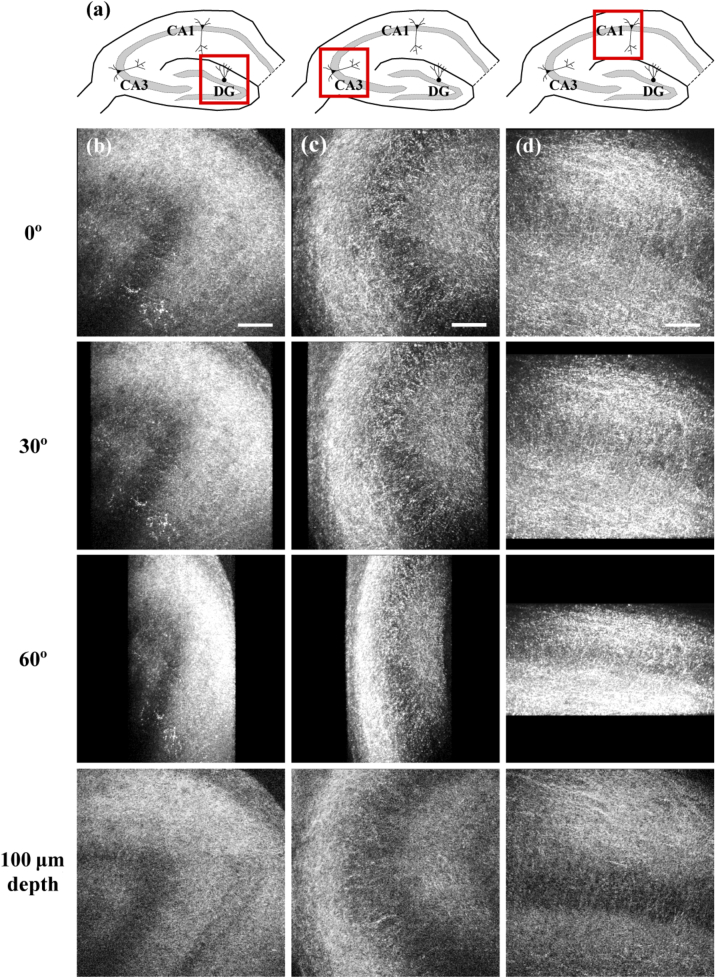
Fig. 5.
Rotational views of maximum projected 100-µm deep organotypic hippocampal slices at , , and relative to the normal projection. (a) Schematic diagram of the rat hippocampus. Solid red boxes indicate imaging regions for (b) - (d). DG: dentate gyrus. (b) MIP of the DG showed a dark granular cell layer and adjacent regions of NPs with high reflectivity and dense fibrillarity. (c) MIP of the CA3 field showed a narrower layer of NPs surrounding a region of dark pyramidal cells. (d) Visible reflective signal contrast was also seen between the cell bodies and NPs in the CA1 field. An image from 100 µm deep in the sample is shown for each imaging region. Scale bar: 100 µm.

