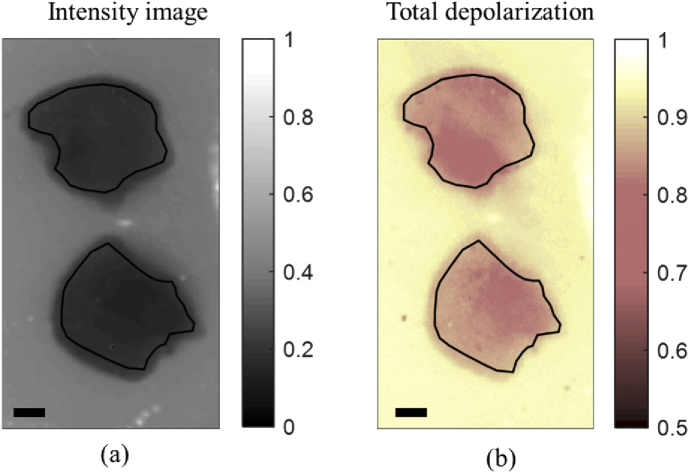
Fig. 5.
(a) Unpolarized total intensity image at 450 nm (m11 element) with black line contours showing the selected ROI. (b) Map of total depolarization with the black ROI contours transferred from (a). The total depolarization data inside the selected ROI were used for the statistical analysis. Scale bar: 1 mm.

