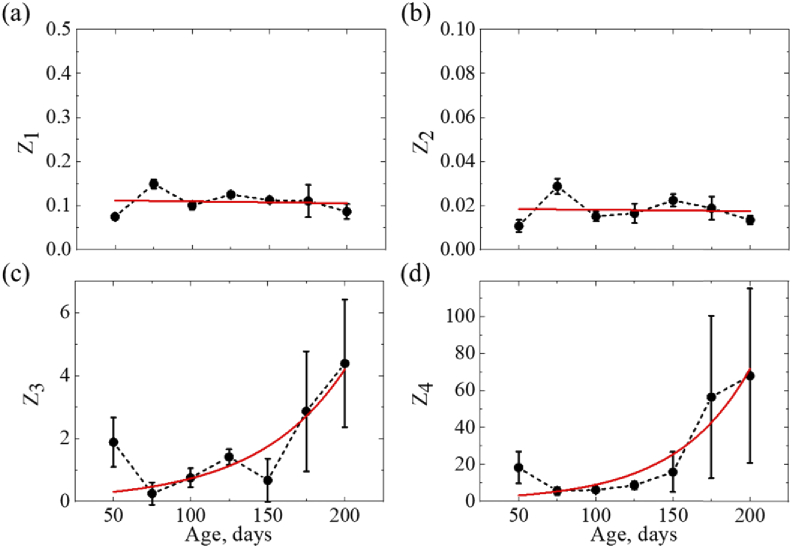
Fig. 7.
Statistical moments of the 1st- 4thorders characterizing the spatial distributions of m22 element of MM measured from FFPE mouse brain with AD (50 to 200 days) at 450 nm: (a) mean, (b) standard deviation, (c) skewness, (d) kurtosis. Red, solid lines show fitting functions: linear in (a, b), exponential in (c, d).

