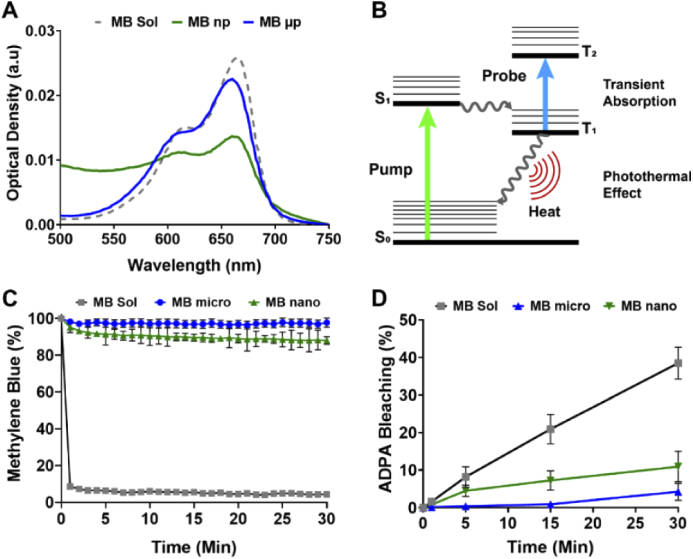
Fig. 3.
(A) Normalized absorption spectrum of MB solution, MB-PLGA microparticles (MB µp), and nanoparticles (MB np). (B) Diagram of molecular energy transitions for the methylene blue transient absorption and photothermal effect. Driven energy transitions are indicated by straight arrows and spontaneous transitions as wavy arrows. (C) Normalized MB fluorescence emission at 680 nm over time after addition of NADH enzyme to free MB, MB-PLGA microparticles and MB-PLGA nanoparticles in DI water. (D) Percentage of ADPA bleaching for free MB, MB-PLGA microparticles and MB-PLGA-nanoparticles with our pump 660 nm light source for 30 min. Value = mean ± SD (n = 3).

