Fig. 3.
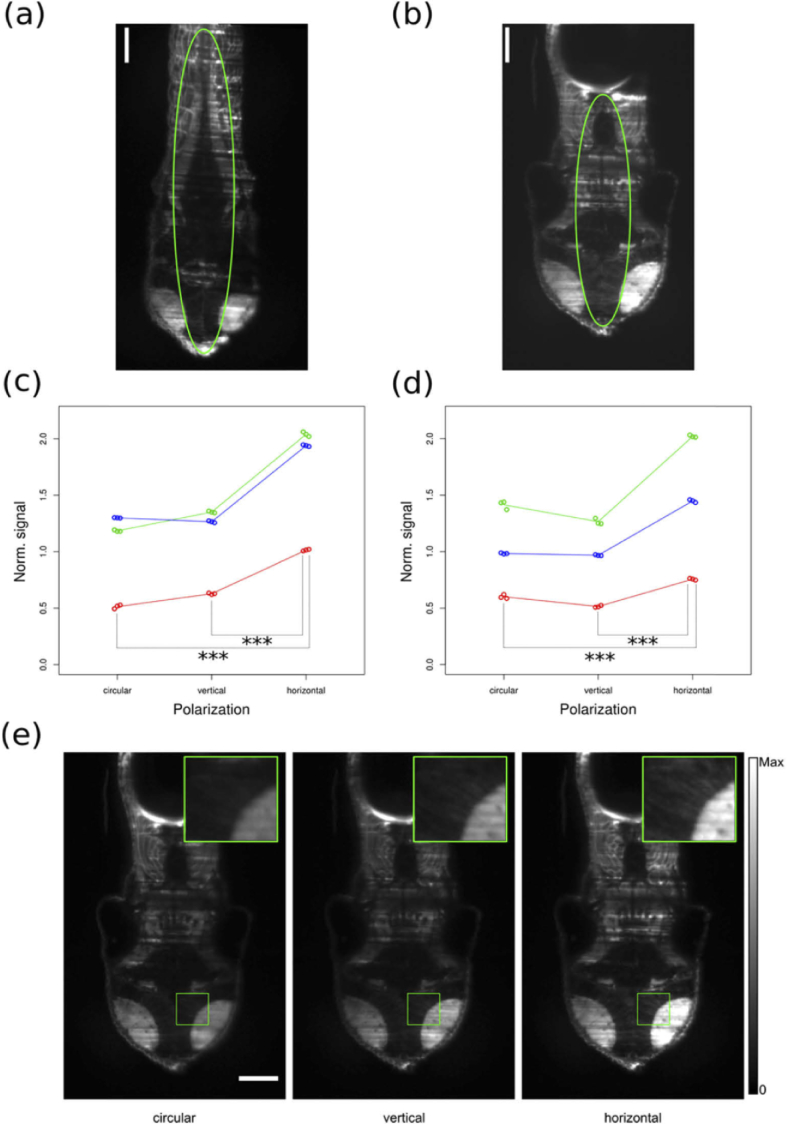
Imaging of Tg(actin:EGFP) larvae in fixed condition, (a) and (c), and in living condition, (b), (d) and (e). (a), (b) Individual z-slices extracted from volumetric acquisitions of larvae representative of the respective conditions. The green ovals indicate the ROIs traced on these larvae. Scale bars: 100 µm. (c), (d) Scatter plots of the average signal measured from the ROIs as a function of the polarization condition. Each point represents an individual acquisition, the points inherent to the same animal are indicated with the same color in the respective graph. The average values for each animal and for each condition are linked with lines of the same color. In each graph the signal value is normalized to the average of the circular polarization case. Statistically significant differences are indicated by three asterisks (p-value < 0.0001). (e) Z-slices extracted from volumetric acquisitions of the same larva as in (b) in the three polarization conditions. The signal intensity is mapped as indicated in the grayscale bar on the right. Magnifications of the areas in the green squares are reported in the insets. Scale bar: 100 µm.

