Fig. 4.
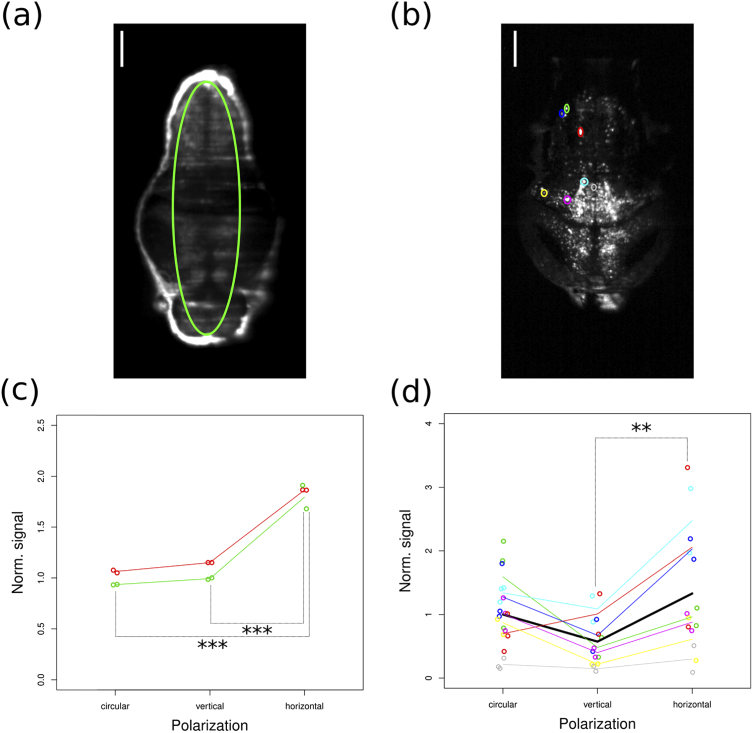
Imaging of Tg(elavl3:H2B-GCaMP6s) larvae in fixed condition, (a) and (c), and in living condition, (b) and (d). (a) Individual z-slice extracted from the volumetric acquisitions of a representative larva. The green oval indicates the ROI measured for this larva. (b) Maximum projection of a sub-volume of the volumetric stack (70 µm along the dorso-ventral direction from the original 150 µm) of the larva. The colored ovals indicate the different ROIs. Scale bars: 100 µm. (c), (d) Scatter plots of the average signal measured from the ROIs traced on the larvae as a function of the polarization condition. The signal value is normalized to the mean of the circular polarization case. Statistically significant differences are indicated by asterisks (***: p-value < 0.0001, **: p-value = 0.0016). (c) Each point represents an individual acquisition, the points inherent to the same animal are indicated with the same color. The average values for each animal and for each condition are linked with lines of the same color. (d) Different colors indicate different ROIs, as shown in (b). For each color, each point represents an individual acquisition. The average values for each ROI and for each condition are linked with lines of the same color. The thick black line indicates the global averages for each condition.

