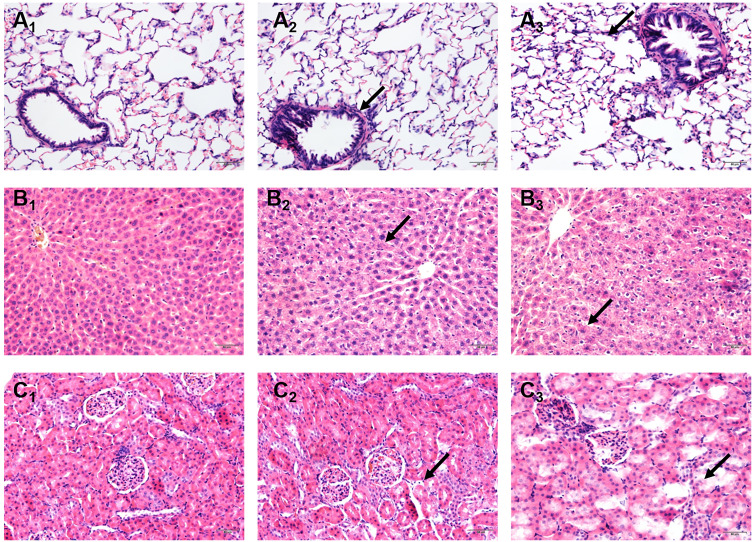
Figure 2.
Effects of Nano-TiO2 exposure on the histopathological changes in the lung, liver, and kidney at 7 days after treatment. (A) The representative images of lung tissue of rats stained with HE. (B) The representative images of liver tissue of rats stained with HE. (C) The representative images of kidney tissue of rats stained with HE. Scale bar represents 50 μm. The arrow in A2 indicated irregular luminal inflammatory cell infiltration; The arrow in A3indicated the alveolar wall thickening. The arrow in B2 indicated cell disorder. The arrow in B3 indicated the spotty necrosis. The arrow in C2 indicated the gap increases. The arrow in C3 indicated necrosis. 1: Control group, 2: 0.2 g/kg group, 3: 1 g/kg group.

