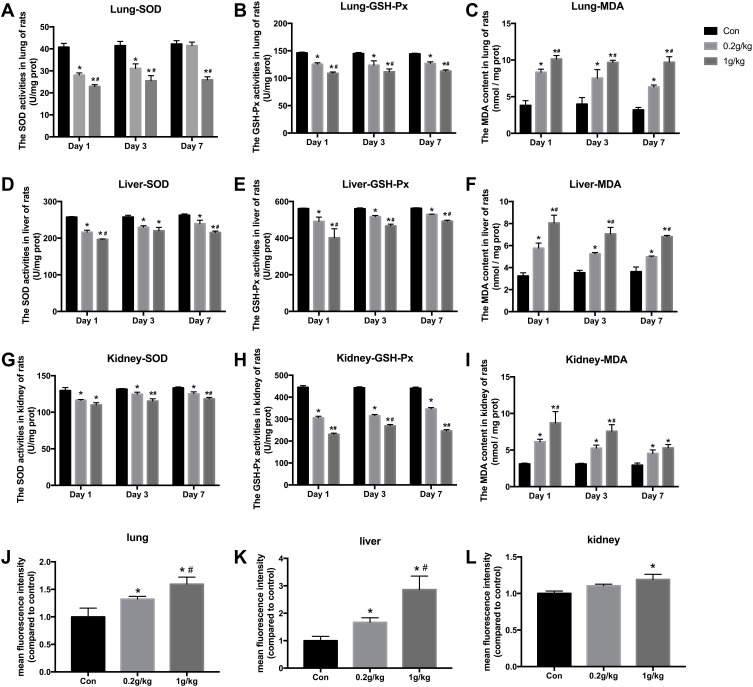
Figure 3.
The oxidative stress levels in the lung, liver, and kidney of rats after Nano-TiO2 treatment. (A–C) The SOD, GSH-Px activities, and MDA content in lung of rats. (D–F) The SOD, GSH-Px activities, and MDA content in liver of rats. (G–I) The SOD, GSH-Px activities, and MDA content in kidney of rats. (J–L) ROS levels induced by Nano-TiO2 in organs of rats. N=5, *P<0.05, in comparison to the control group; #P<0.05, in comparison to the 0.2 g/kg group.
Abbreviations: SOD, superoxide dismutase; GSH-Px, glutathione peroxidase; MDA, malonaldehyde.

