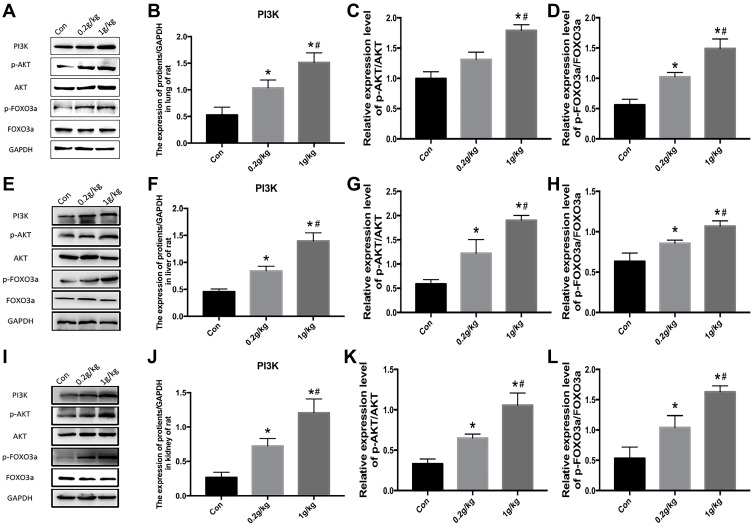
Figure 5.
Activation of the PI3K-AKT-FOXO3a signal pathway in the lung, liver, and kidney of rats after Nano-TiO2 treatment for 7 days. (A) The represented protein bands of PI3K, AKT, FOXO3a, p-AKT, and p-FOXO3a in the lung. (B–D) The fold changes of PI3K, p-AKT/AKT, and p-FOXO3a/FOXO3a levels in the lung. (E–H) The represented protein bands and fold changes of PI3K, AKT, FOXO3a, p-AKT, and p-FOXO3a in the liver. (I–L) The represented protein bands and fold changes of PI3K, AKT, FOXO3a, p-AKT, and p-FOXO3a in the kidney. N=5, *P<0.05, in comparison to the control group. #P<0.05, in comparison to the 0.2 g/kg group.
Abbreviations: PI3K, phosphatidyl inositol 3-kinase; AKT, protein kinase B; FOXO3a, the Fork head box class O 3a.

