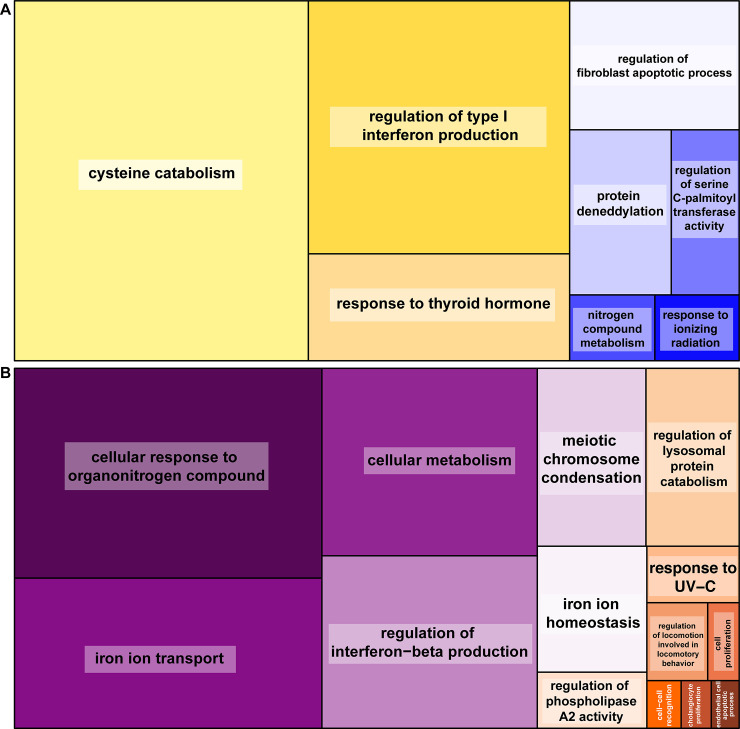
Fig 3. REVIGO treemaps for genes differentially expressed based on experimental immune group or sex.
REVIGO treemaps showing semantically clustered enriched GO terms (colored tiles) with box size proportional to normalized adjusted p-value and clusters are shown for (A) experimental immune groups (top), and (B) sex-biased among males and females (bottom). The white labels on panel B are cell-cell recognition, cholangiocyte proliferation, and endothelial cell apoptotic process.

