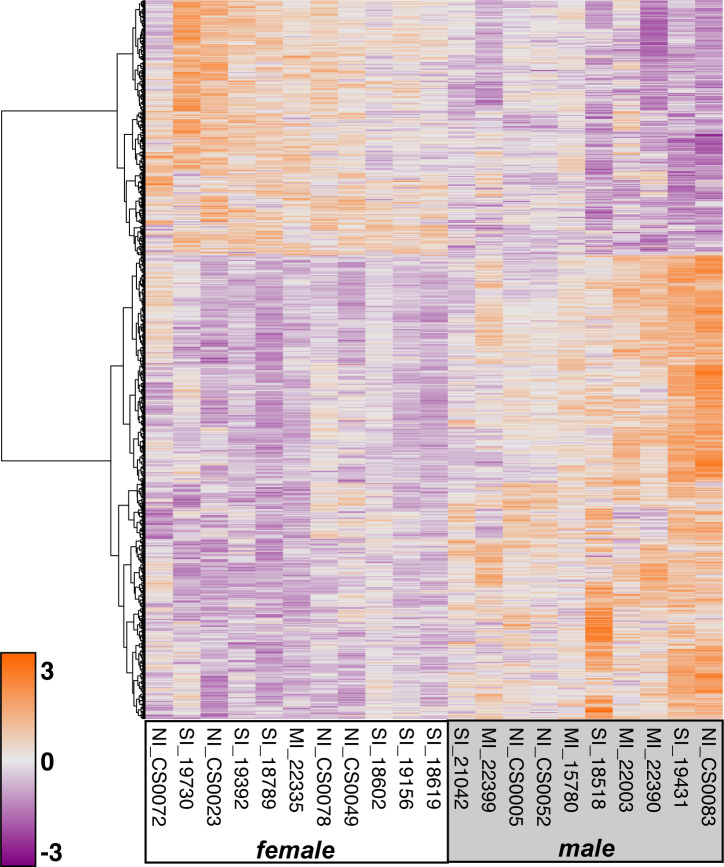
Fig 4. Heatmap of 1,037 genes uniquely differentially expressed by sex.
Genes are clustered by the Ward method according to Manhattan distance. All genes shown (rows) are statistically significantly expressed (adjusted α < 0.05). Color scale presents the amount of expression. Expression values are mean-centered, regularized log counts and colors are represented as z-score values.

