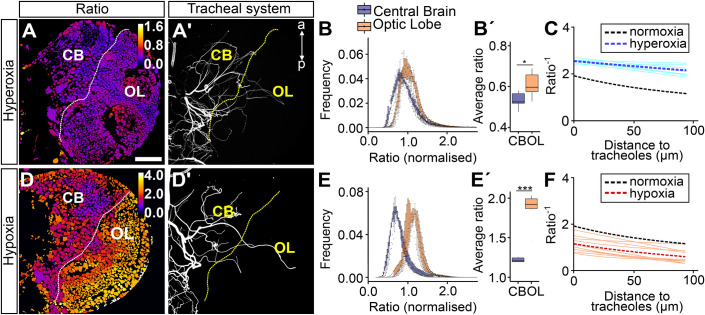
Fig. 5.
GFP-ODD degradation is driven by oxygen availability. Ratiometric images for larvae exposed to hyperoxia (A, n=7) and hypoxia (D, n=7) and the corresponding maximum projection of their tracheal system (Calcofluor; A′,D′). Larvae reared in ambient hyperoxia show a left-shift (higher oxygen) in the distribution of optic lobe ratio values (B). Brains of larvae exposed to hyperoxia show lower ratio values both for central brain and optic lobe (B′). (E) Larvae reared in hypoxia showed two distinct populations of values for central brain and optic lobe as observed in normoxia (see Fig. 3E). (E′) Hypoxia-reared larvae showed increased non-normalized mean ratio values (i.e. lower oxygen) as compared to normoxia. (C,F) ratio−1 (oxygenation) plotted against minimum distance to tracheoles. Sky blue lines (C) and orange lines (F) show exponential fits for different brains from larvae reared in hyperoxia and hypoxia, respectively. Dotted lines show average of all fits for normoxia (black), hyperoxia (dark blue) and hypoxia (red). Scale bar is applicable to all panels and is 40 µm. *P<0.05, **P<0.01, ***P<0.001 Student’s t-test or Mann–Whitney Wilcoxon test.

