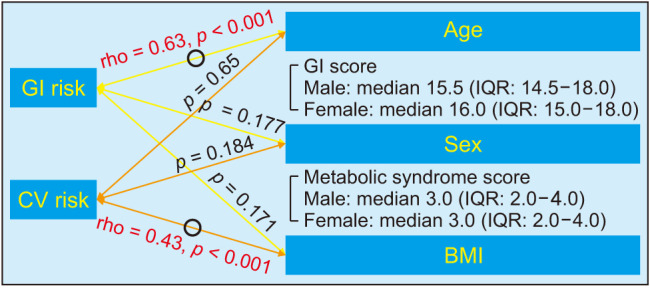
Fig. 3. Relationship between GI/CV risk and demographic variables (age, sex, and BMI). The arrows marked with O indicate a significant correlation, otherwise the correlation is nonsignificant. Spearman correlation analysis was performed for age and BMI. A Mann-Whitney U-test was performed for sex. GI: gastrointestinal, CV: cardiovascular, IQR: interquartile range, BMI: body mass index.

