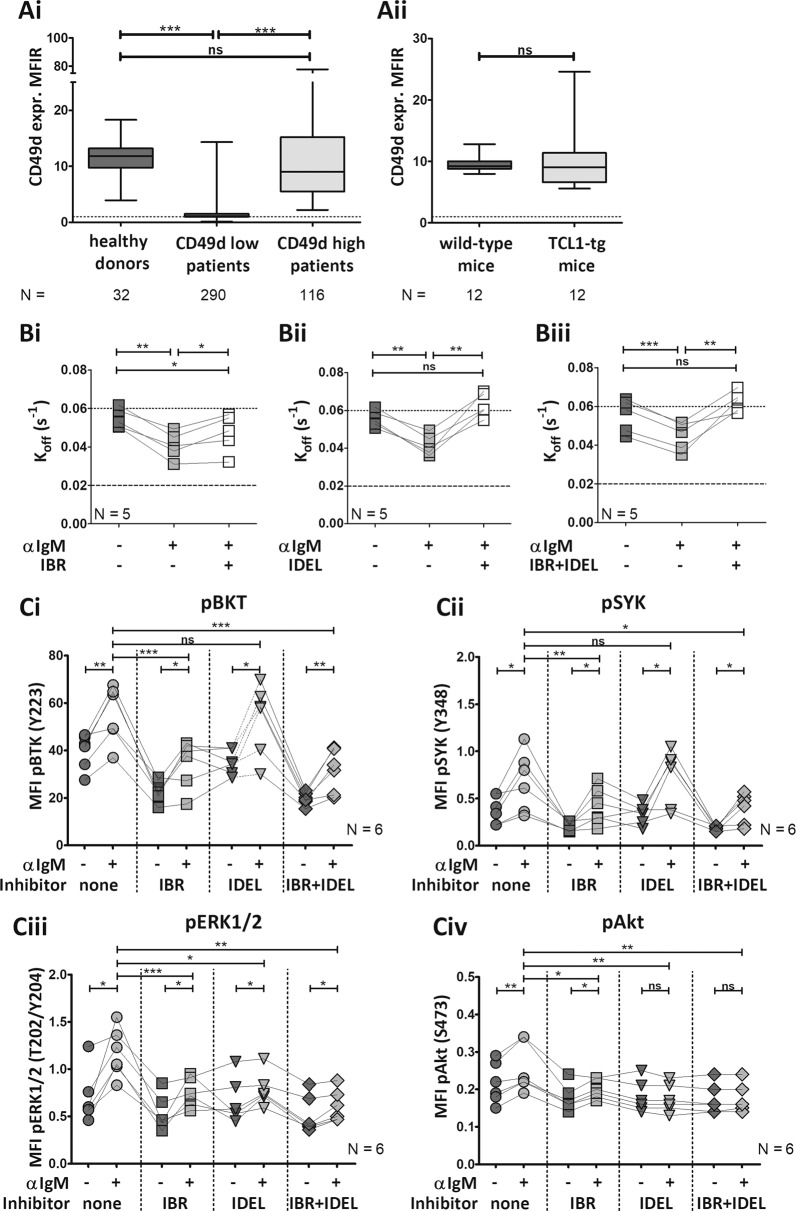
Fig. 1. TCL1-tg leukemic cells resemble human CD49d-high CLL cells in their CD49d expression and VLA-4 inside-out signaling.
a The expression of the rate-limiting alpha subunit of VLA-4, CD49d, was measured by flow cytometry. Samples collected from peripheral blood of age-matched (Ai) healthy donors (N = 32), CD49d-low (N = 290) or CD49d-high CLL patients (N = 116), and (Aii) C57BL/6 J wild-type (N = 12) or TCL1-tg mice (N = 12) were stained with anti-CD5 and anti-CD19, as well as CD49d-specific or its isotype control antibody. MFIR mean fluorescence intensity ratio (human measurements: arithmetic mean, mouse measurements: geometric mean). Dotted line: MFIR = 1. Unpaired t tests were performed by GraphPad Prism5. b Purified murine CD5+/CD19+ cells (N = 5) were treated for 1 h with/without 1 μM (Bi) ibrutinib (IBR), (Bii) idelalisib (IDEL), or (Biii) both. The dissociation rate (koff) of VLA-4 and its ligand LDV was determined by real-time flow cytometry. Koff values are shown upon different stimulation states: resting (negative control), anti-IgM-stimulated (F(ab′)2, 10 μg/ml), and pretreated + anti-IgM-stimulated. A koff value above 0.06 s−1 (dotted line) is considered “low affinity”, while values below 0.02 s−1 (dashed line) are “high affinity.” Connecting lines indicate values from the same tumor. Nonlinear fit “Plateau followed by one-phase decay” and paired t tests were performed using GraphPad Prism5. c Ibrutinib and idelalisib differentially affect BCR signaling in TCL1-tg mice. Splenocytes from TCL1-tg mice (N = 6) were pretreated with/without ibrutinib, idealisib or both (1 μM, 1 h). Cells were stained with anti-CD3 for T cell exclusion and with fixable viability dye, followed by a stimulation by anti-IgM (F(ab′)2, 10 μg/ml, 5 min). Cells were fixed and permeabilized, stained with phosflow antibodies, and measured by flow cytometry. The mean fluorescence intensity (MFI, geometric mean) values of (Ci) pBTK, (Cii) pSYK, (Ciii) pERK1/2, and (Civ) pAkt of viable CD3-negative cells are shown. To validate whether the CD3-negative cell population corresponds with the leukemic cells, the samples were stained with anti-CD5 and anti-CD19 in parallel. Connecting lines indicate values from the same tumor. Paired t tests were performed by GraphPad Prism5. *P < 0.05; **P < 0.01; ***P < 0.001, ns nonsignificant.

