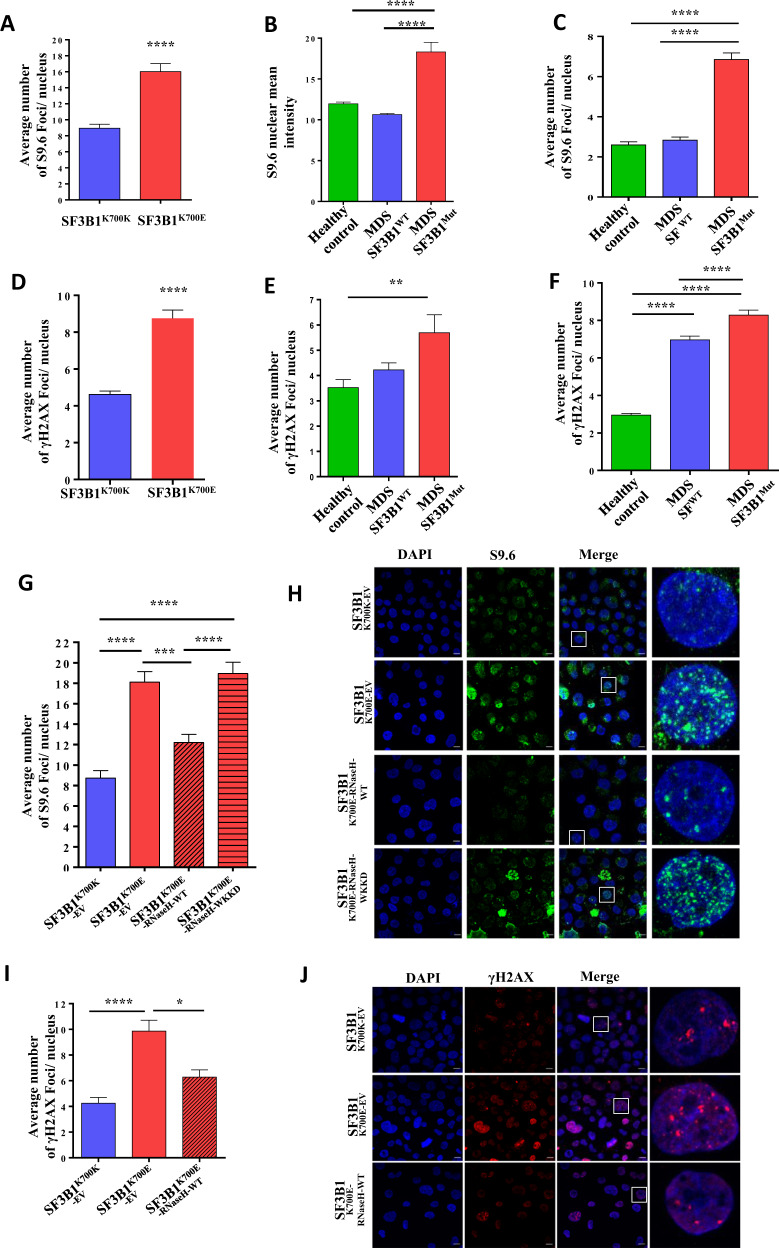
Fig. 1. SF3B1 mutation leads to increased R-loops and associated DNA damage response.
Quantitative analysis of S9.6 foci detected by immunocytochemistry in (a) SF3B1K700K and SF3B1K700E K562 cells (n > 300 cells/category) (b) iPSC clones generated from an MDS patient sample with SF3B1 mutation (MDS SF3B1Mut: iPSC clone harboring the SF3B1 mutation; MDS SF3B1WT: iPSC clone without the SF3B1 mutation) and from a healthy control (n > 150 cells/category) (c) CD34+ cells from MDS patients with SF3B1 mutation (MDS SF3B1Mut), from MDS patients without splicing factor mutations (MDS SFWT), and from healthy controls (n > 300 cells/category). Quantitative analysis of γ-H2AX foci detected by immunocytochemistry in (d) SF3B1K700K and SF3B1K700E K562 cells (n > 300 cells/category) (e) iPSC clones generated from an MDS patient sample with SF3B1 mutation (MDS SF3B1Mut: iPSC clone harboring the SF3B1 mutation; MDS SF3B1WT: iPSC clone without the SF3B1 mutation) and from a healthy control (n > 100 cells/category) (f) CD34+ cells from MDS patients with SF3B1 mutation (MDS SF3B1Mut), from MDS patients without splicing factor mutations (MDS SFWT), and from healthy controls (n > 150 cells/category). g Quantitative data and h representative images of S9.6 foci detected by immunocytochemistry in SF3B1K700K-EV, SF3B1K700E-EV, SF3B1K700E-RNaseH-WT, and SF3B1K700E-RNaseH-WKKD K562 cells (n > 300 cells/category). Green- S9.6; blue- DAPI. i Quantitative analysis and j representative images of γ-H2AX foci in SF3B1K700K-EV, SF3B1K700E-EV, and SF3B1K700E-RNaseH-WT K562 cells (n > 150 cells/category). Red- γ-H2AX; blue: DAPI. All values are plotted as mean ± SEM. P values in a and d were obtained using the unpaired Student’s T test. P values in b–c, e–g, i were obtained using one-way ANOVA with the Tukey’s multiple comparisons test. *P < 0.05; **P < 0.01; ***P < 0.001; ****P < 0.0001. Scale bar −10 µm.

