Figure 1.
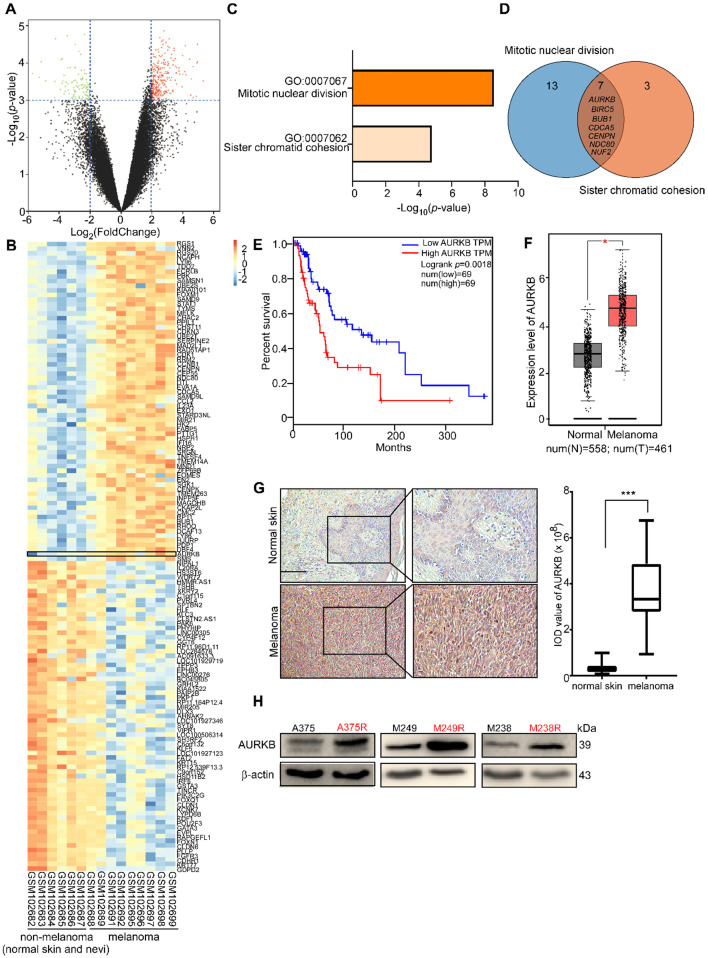
Database analysis and AURKB expression level in melanoma. (A) Volcano plot of gene expression analysis in GSE 4587. The X-axis indicates the fold change between normal skin or nevi and melanoma samples, and the Y-axis indicates on a log10 scale the p-values obtained from a supervised logistic regression analysis testing the association of gene expression between normal skin or nevi/melanoma. The horizontal dotted lines mark the significance cutoffs (i.e., fold change more than 4 times or less than 0.25, and p-value less than 0.001). (B) Heat map of analysis of the expression of these selected genes in GSE 4587. AURKB has a higher expression level in melanoma compared with non-melanoma (normal skin and nevi). (C) Pathway enrichment analysis of differential gene analysis. The top 2 pathways were selected, fold change more than 4 times, p-value less than 0.0001. (D) The Venn diagram lists the common genes in both pathways. (E) Melanoma patients with high expression of AURKB show a significantly lower overall survival rate. (F) AURKB is highly expressed in melanoma compared with normal skin as determined by GEPIA. (G) AURKB is significantly overexpressed in melanoma tissue compared with normal skin as shown in a tissue array analysis; the scale bar = 100 µm. (H) AURKB is overexpressed in drug-resistant melanoma cell lines (A375R, M238R, and M249R) compared with drug-sensitive melanoma cell lines (A375, M238 and M249). Statistical significance was determined by Student's t-test and the asterisks indicate a significant change compared with the control group (*, p < 0.05; ***, p < 0.001).

