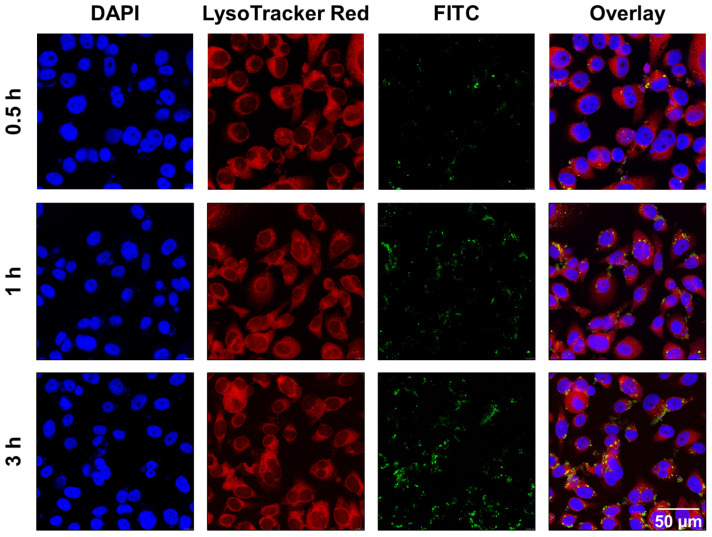
Figure 3.
Intracellular uptake of CaO2@HMSNs-PAA in PC-3 cells. Confocal laser scanning microscopy (CLSM) images of PC-3 cells describing the intracellular uptake of FITC-labeling CaO2@HMSNs-PAA (green) with the nuclei stained by DAPI (blue) and lysosomes labeled by LysoTracker Red (red) after incubation for 0.5 h, 1 h and 3 h. Scale bar, 50 µm.

