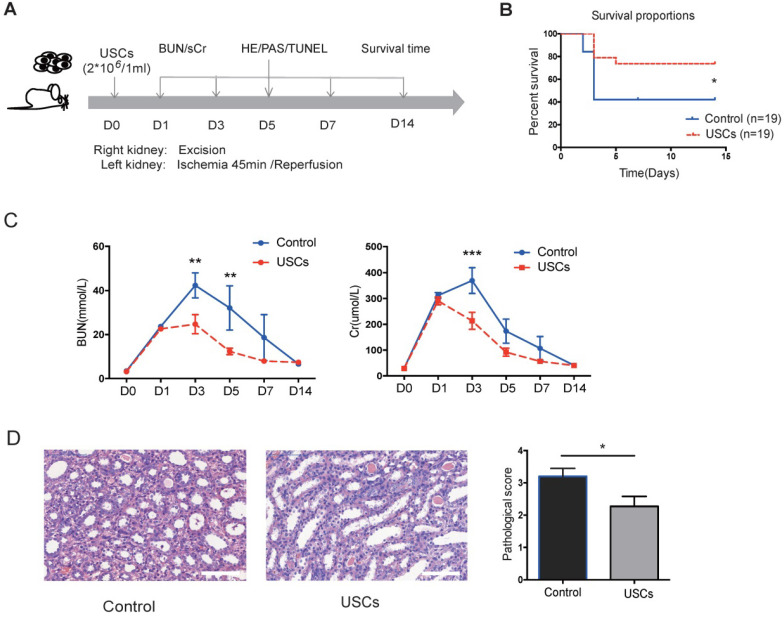
Figure 2.
The protective effects of USCs on renal function after renal IRI. (A) Diagram of the ischemia-reperfusion injury (IRI) animal model. (B) Survival curves for the control and USC-treated groups (Control group, n=19; USC-treated group, n=19; P= 0.0328). (C) Time-dependent changes in blood urea nitrogen (BUN) and serum creatinine (sCr) in control (n=25) and USC-treated groups (USCs, n=26) at days 1, 3, 5, 7 and 14 after IRI (BUN: P= 0.0028 on day 3, P= 0.0066 on day 5; sCr: P<0.0001 on day 3). Data represent the mean ± SEM, *P<0.05, **P<0.01, ***P<0.001. (D) Histopathological scores for control (n=10) and USC-treated groups (USCs, n=11) on day 7 (P= 0.0311). Scale bars =100 µm. Data represent the mean ± SEM, *P<0.05, **P<0.01.

