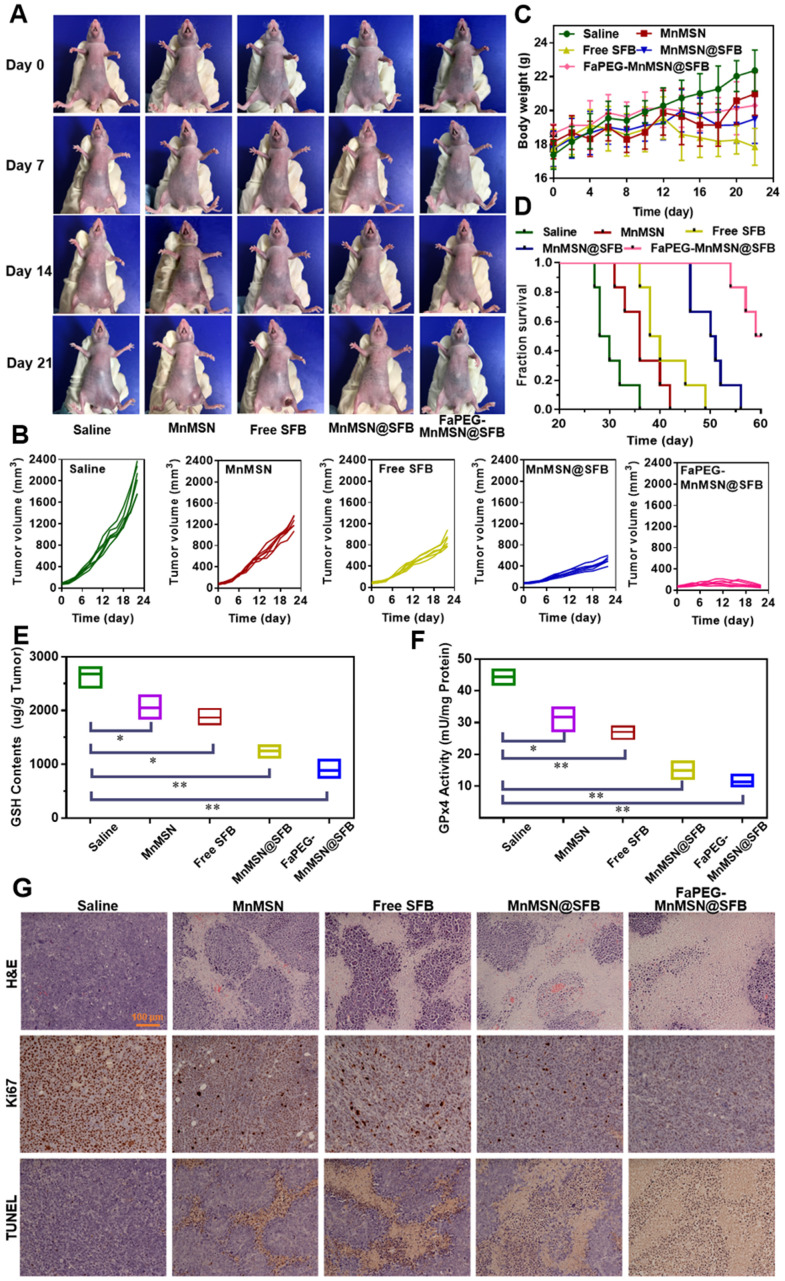
Figure 11.
Typical images of HepG2 tumor-bearing mice at predetermined time intervals after injection of Saline, MnMSN, Free SFB, MnMSN@SFB, or FaPEG-MnMSN@SFB at a SFB-equivalent dose of 10 mg/kg (A). The tumor volume changes (B), body weight changes (C) and Kaplan-Meier survival curves (D) of nude mice in each group during the treatment period (n=6). The intratumoral GSH (E) and GPx4 (F) levels after various treatment. The H&E, Ki67 and TUNEL staining images of tumor tissues indicating the tissue necrosis, cell proliferation and cell apoptosis (G), scale bar is 100 µm.

