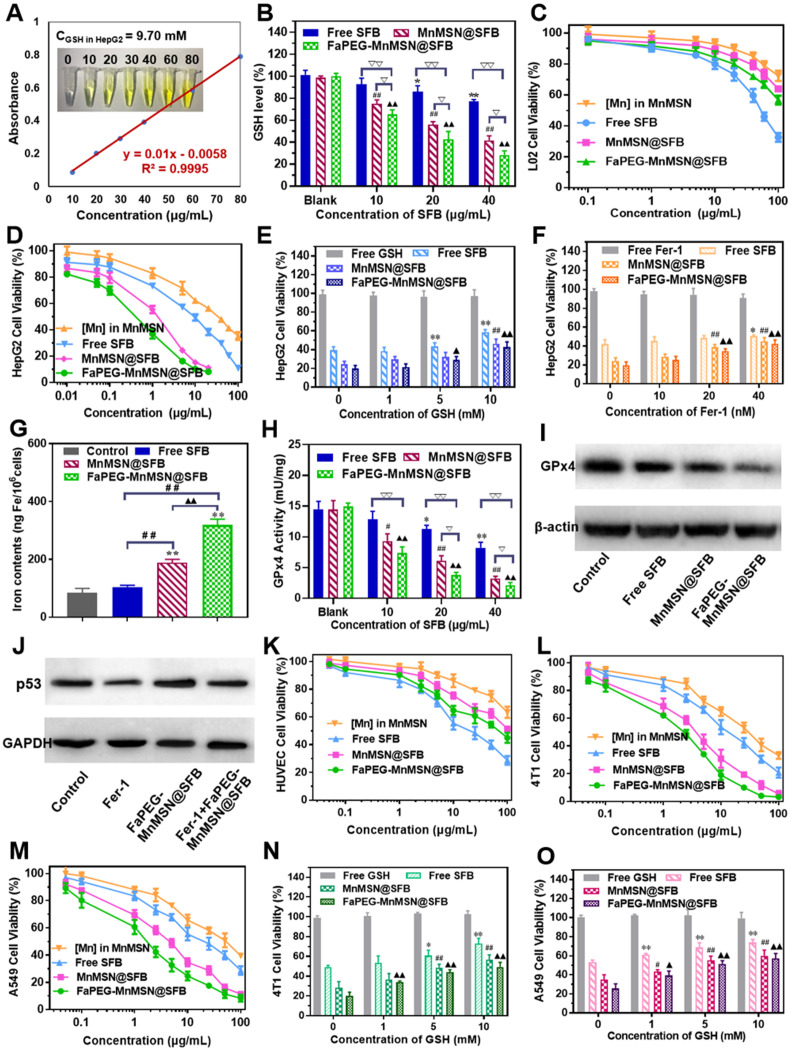
Figure 5.
The real GSH concentration in HepG2 cells (A). GSH levels of HepG2 cells after incubated with Free SFB, MnMSN@SFB and FaPEG-MnMSN@SFB at concentrations ranging from 0 µg/mL to 40 µg/mL (B). *P < 0.05, **P < 0.01, #P < 0.05, ##P < 0.01, ▲P < 0.05, ▲▲P < 0.01 vs Blank group. ▽P < 0.05, ▽▽P < 0.01 vs cells treated with FaPEG-MnMSN@SFB. Cell viability of L02 (C) and HepG2 (D) cells after treated with MnMSN, Free SFB, MnMSN@SFB and FaPEG-MnMSN@SFB at different concentrations. The cell viability of HepG2 cells after treated with SFB formulations (containing 20 µg/mL SFB) and GSH (E) or Fer-1 (F). *P < 0.05, **P < 0.01, #P < 0.05, ##P < 0.01, ▲P < 0.05, ▲▲P < 0.01 vs without inhibitor. Iron contents in HepG2 cells after treated with Free SFB, MnMSN@SFB and FaPEG-MnMSN@SFB at the concentration of 20 µg/mL (G). **P < 0.01 vs Blank group. ##P < 0.01 vs cells treated with FaPEG-MnMSN@SFB. ▲▲P < 0.01 vs cells treated with MnMSN@SFB. GPx4 activity of HepG2 cells after treated with Free SFB, MnMSN@SFB and FaPEG-MnMSN@SFB for different concentrations (H). *P < 0.05, **P < 0.01, #P < 0.05, ##P < 0.01, ▲P < 0.05, ▲▲P < 0.01 vs Blank group. ▽P < 0.05, ▽▽P < 0.01 vs cells treated with FaPEG-MnMSN@SFB. GPx4 expression of HepG2 cells after treated with Free SFB, MnMSN@SFB and FaPEG-MnMSN@SFB at a concentration of 20 µg/mL (I). p53 expression of HepG2 cells after treated with Fer-1, FaPEG-MnMSN@SFB and Fer-1+ FaPEG-MnMSN@SFB at a concentration of 20 µg/mL (J). Cell viability of HUVEC (K), 4T1 (L) and A549 (M) cells after treated with MnMSN, Free SFB, MnMSN@SFB and FaPEG-MnMSN@SFB at different concentrations. The cell viability of 4T1 (N) and A549 (O) cells after treated with SFB formulations (containing 20 µg/mL SFB) and GSH. *P < 0.05, **P < 0.01, #P < 0.05, ##P < 0.01, ▲P < 0.05, ▲▲P < 0.01 vs without inhibitor.

