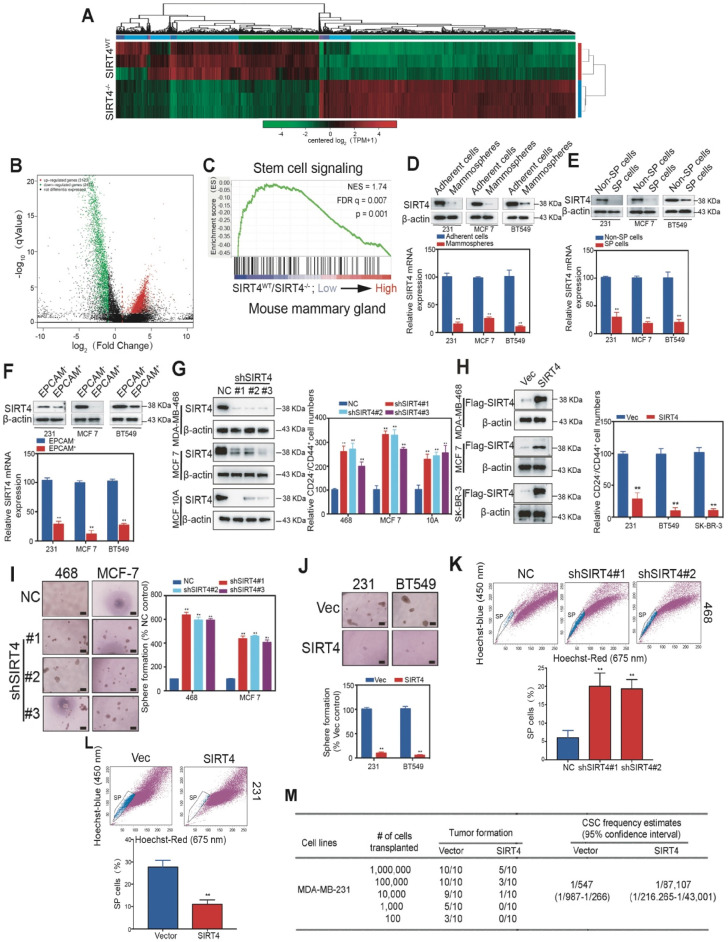
Figure 3.
SIRT4 inhibits self-renewal and expansion of breast tumor-initiating cells (BTICs). (A) Heatmap summarizing genes differentially expressed in SIRT4-/- compared to SIRT4WT mice. (B) Volcano plot displaying differentially expressed genes. Up-regulated genes (3123) are highlighted in red. Down-regulated genes (2477) are highlighted in green. Black dots represent genes not differentially expressed. (C) Enrichment of a stem cell signaling in GSEA analysis of genes altered as described above. (D, E, F) Immunoblotting (upper panel) and mRNA expression (bottom panel) of SIRT4 in CSC-enriched mammospheres (D), side population (SP) cells (E), and EPCAM+ cells (F) as well as their corresponding controls, i.e., adherent cells (A), non-SP cells (C), and EPCAM- cells (E). (G) Quantification of CD44+/CD24- subpopulations (right panel) and immunoblotting of SIRT4 expression (left panel) in MDA-MB-231, MCF-7, and BT549 cells transfected with sh-SIRT4 or negative control (NC). (H) Quantification of CD44+/CD24- subpopulations (right panel) and immunoblotting of SIRT4 expression (left panel) in MDA-MB-468, MCF-10A, and SK-BR-3 cells transfected with SIRT4 or control vector (Vec). (I, J) Sphere formation efficiency of cells described in G (I) and H (J), respectively. (K, L) Hoechst SP assay of cells described in G (K) and H (L), respectively. (M) Tumor formation ability of MDA-MB-231 cells expressing control (Vector) or SIRT4 vector. The transfected MDA-MB-231 cells were assayed for the ability to form tumors by subaxillary injection of 1 × 10⁶, 1 × 10⁵, 10,000, 1,000, and 100 cells into nude mice. The numbers of tumors formed and the number of injections that were performed is listed for each population. Data are means ±SEM. **p < 0.01; t-test. Scale bars, 100 µm (I and J).

