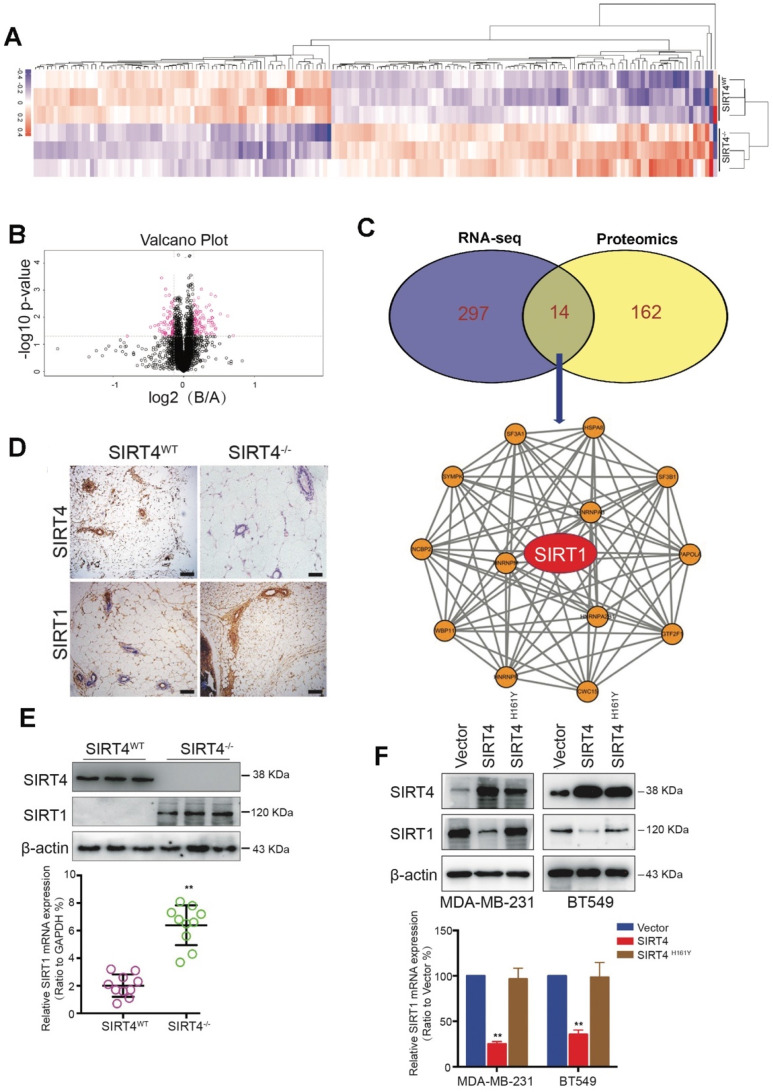
Figure 4.
Proteome-wide analysis of SIRT4 deficiency-induced expression in mouse mammary gland cells. (A) Heatmap depicting proteins differentially expressed in mammary epithelial cells from SIRT4WT and SIRT4-/- mice. Up-regulated proteins are highlighted in pink. Down-regulated proteins are highlighted in purple. (B) Volcano plot displaying differentially expressed proteins in SIRT4-/- compared to SIRT4WT mice. (C) Venn diagram showing the overlap of genes (purple) and proteins (yellow) differentially expressed in mammary epithelial cells from SIRT4WT and SIRT4-/- mice (upper); Protein-Protein-Interaction Network including the 14 overlapped proteins in Venn diagram (bottom). (D) Representative IHC staining images of SIRT4 and SIRT1 in tumor sections isolated from SIRT4WT and SIRT4-/- mice. (E, F) Immunoblotting (upper panel) and mRNA expression (bottom panel) of SIRT1 in tumors isolated from SIRT4-/- and SIRT4WT mice (E), and in MDA-MB-231 and BT549 cells transfected with control (Vector), SIRT4 or mutated SIRT4 (H161Y) vector (F). Data are means ±SEM. **p < 0.01; t-test (E and F). Scale bars, 100 µm (D).

