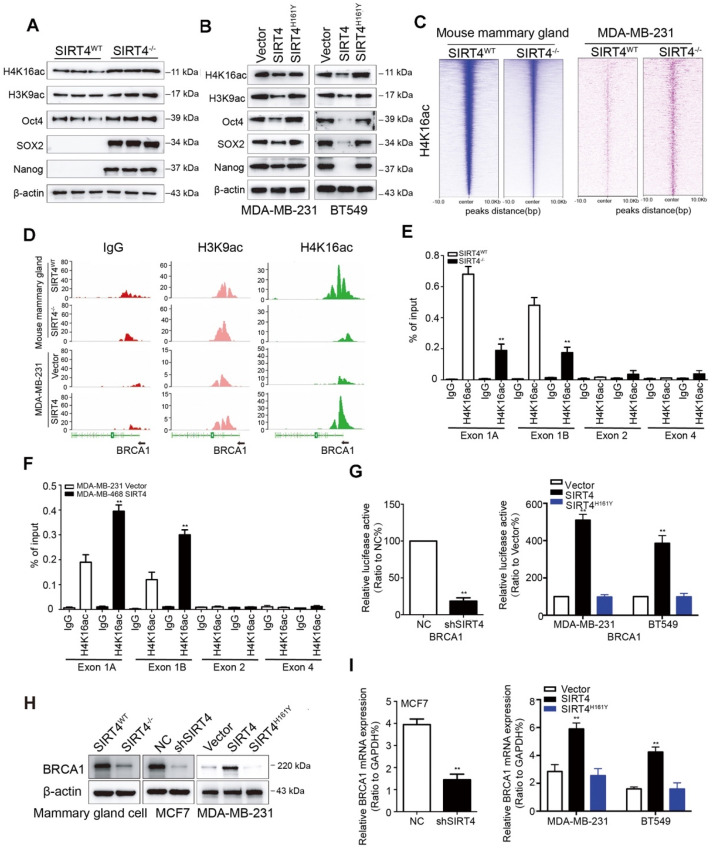
Figure 5.
SIRT4 deficiency down-regulates BRCA1 expression. (A, B) Immunoblotting of acetyl-histone H4 at lys16 (H4K16ac), acetyl-histone H3 at lys9 (H3K9ac), Oct4, SOX2, and Nanog in mammary cells isolated from SIRT4-/- as well as SIRT4WT mice (A), and in MDA-MB-231 (left panel) as well as BT549 cells (right panel) transfected with control (Vector), SIRT4 or mutated SIRT4 (H161Y) vector (B). (C) Heatmap summarizing chromatin immunoprecipitation (ChIP)-seq data for H4K16ac, comparing mammary cells from SIRT4WT and SIRT4-/- mice (left panel), as well as MDA-MB-231 cells transfected with control (Vector) or SIRT4 vector (right panel). Profiles are centered on H4K16ac binding peaks and depict signal intensity (relative fold enrichment) with green color. (D) ChIP signal of IgG (left panel, red peaks), H3K9ac (middle, blue peaks), and H4K16ac (right panel, green peaks) in the indicated genomic regions of BRCA1 in cells described in C. (E, F) Mammary cells from SIRT4WT as well as SIRT4-/- mice (E) and transformed MDA-MB-468 cells (F) as described in C and Fig.3G were chromatin immunoprecipitated for IgG and H4K16ac. Pull-down at the putative H4K16ac binding sites was assessed by qRT- PCR and calculated as the percentage of IgG input. Error bars are SEM for 3 technical replicates. (G) Luciferase reporter assays showing the impact of SIRT4 deletion (left), as well as overexpression of SIRT4 and its mutation (H161Y) on BRCA1 promoters (right panel) in SIRT4-/- as well as SIRT4WT mammary cells, and MDA-MB-231 as well as BT549 cells, respectively. (H, I) Immunoblotting (H) and mRNA expression (I) of BRCA1 in cells described above. Data are means ±SEM. **p < 0.01; t-test.

