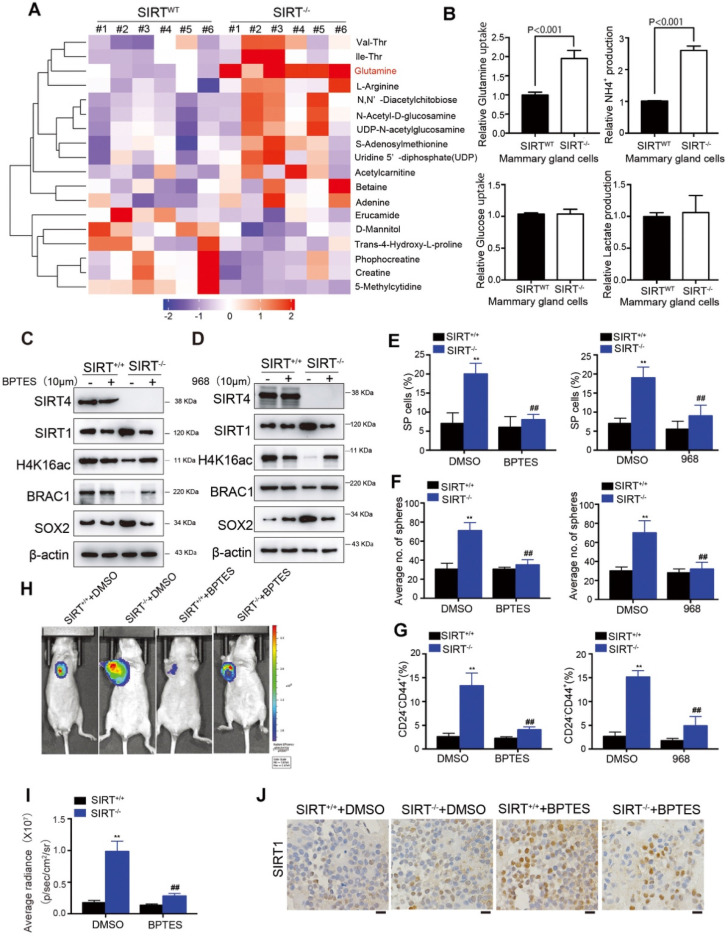
Figure 7.
Glutamine metabolism disorder mediates SIRT4-induced SIRT1 inhibition in breast cancer cells. (A) Heatmap showing the changes in metabolites levels between SIRT4WT and SIRT4-/- mice. Up-regulated metabolites are highlighted in red. Down-regulated metabolites are highlighted in purple. (B) Measurement of Glutamine uptake (upper left), NH4+ production (upper right), Glucose uptake (bottom left), and lactate production (bottom right panel) in mammary epithelial cells from SIRT4WT and SIRT4-/- mice. (C, D) Immunoblotting of indicated proteins isolated from SIRT4WT and SIRT4-/-mammary cells with or without BPTES (10 µM) (C) and 968 (10 µM) (D) treatment. (E, F, G) Quantification of Hoechst SP assay (E), sphere formation efficiency (F), and CD44+/CD24- subpopulations (G) in SIRT4WT and SIRT4-/-mammary cells with or without BPTES (left) and 968 (right panel) treatment. (H, I) Representative ventral view images of bioluminescence from mice with injections of cells described above (H) and its quantification (I). (J) Representative IHC staining images of BRCA1 in tumor sections isolated from mice described in H. Data are means ± SEM. **p < 0.01; t-test. Scale bars, 100 µm (J).

