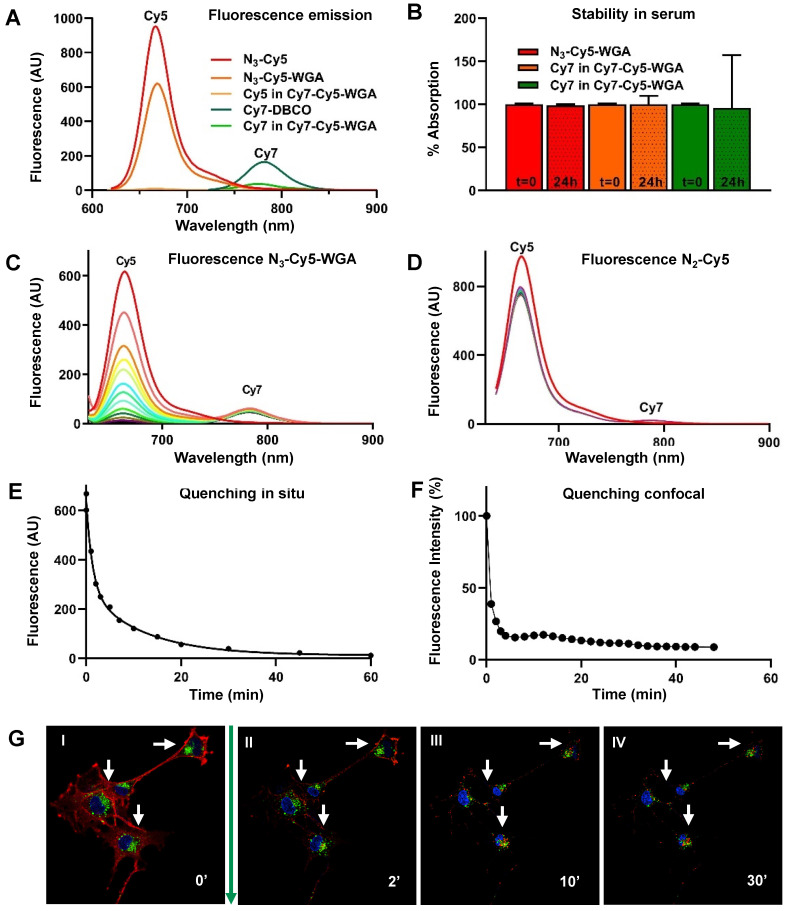
Figure 1.
In situ and in vitro quenching of N3-Cy5-WGA after addition of Cy7-DBCO. A) Fluorescence absorption and emission of N3-Cy5, N3-Cy5-WGA, Cy7-DBCO, and the Cy5 and Cy7 signal in Cy7-Cy5-WGA. B) Stability of N3-Cy5-WGA and the Cy5 and Cy7 signal in Cy7-Cy5 in serum at t = 0 and t = 24 hours (dashed). Absorbance spectroscopy over the course of 60 minutes with a 5-minute interval between measurements (color coding per interval from red to purple) of the absorbance spectrum of C) N3-Cy5-WGA and D) the non-azide containing Cy5-NH2 after mixing with Cy7-DBCO (excitation light of 620 nm and an excitation- and emission slit of 10) with color scaling between t=0 (highest Cy5 intensity) and t=60 minutes. N3-Cy5-WGA emission peak detected at 630 nm, Cy7-DBCO emission peak detected at 780 nm. E) Normalized change of in situ fluorescence intensity over time after addition of Cy7-DBCO to N3-Cy5-WGA. F) Quantified decrease of in vitro N3-Cy5-WGA-related fluorescence in RT4 D6P2T cells assessed using fluorescence confocal microscopy over time after addition of Cy7-DBCO and subsequent formation of Cy7-Cy5-WGA. Herein the fluorescence intensity (%) depicts the normalized fluorescence percentage of fluorescence intensity, wherein the intensity measured at t = 0 (prior to addition of Cy7-DBCO) was set at 100%. G) Fluorescence confocal microscopy images of RT4 D6P2T cells after addition of N3-Cy5-WGA (I; t = 0 minutes, λex 633 nm) and at II) t = 1 minutes, III) t = 5 minutes and IV) t = 30 minutes after addition of Cy7-DBCO with N3-Cy5-WGA in red, lysosomes in green and the cell nucleus in blue.

