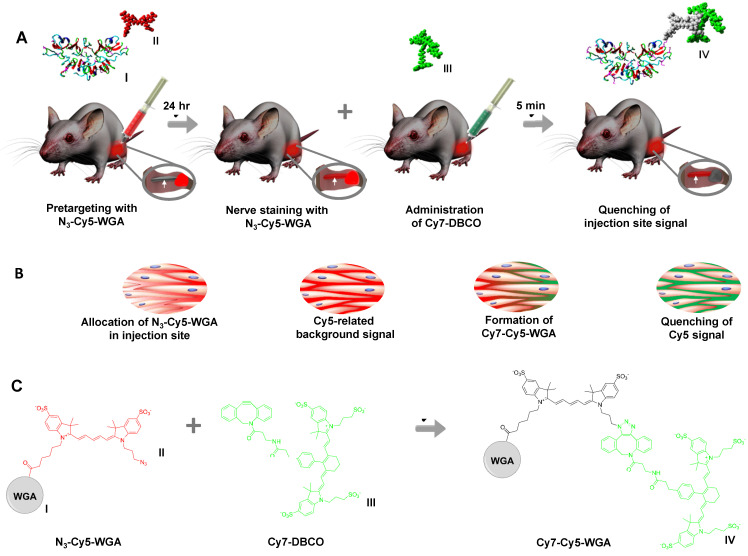
Scheme 1.
Schematic overview of deactivation signal injection site. A) Molecular representation of N3-Cy5-WGA with I representing WGA and II representing N3-Cy5. Pretargeting through injection of N3-Cy5-WGA (in red) in the quadriceps femoris muscle near the nervus ischiadicus and nerve staining at 24 hours after tracer administration. Insert showing the nervus ischiadicus (white arrow) and the injection site (in red) located in the hind leg. Molecular representation of Cy7-DBCO (III) and injection of Cy7-DBCO (in green) followed by subsequent Cy5-quenching at the injection site within 5 minutes after quencher administration. Insert showing the portion of the nervus ischiadicus stained by N3-Cy5-WGA (in red) and the quenching of the primary injection site (in grey) after the formation of Cy7-Cy5-WGA (IV). B) The corresponding distribution of N3-Cy5-WGA (Cy5 in red) and DBCO-Cy7/Cy7-Cy5-DBCO (Cy7 in green) over the extracellular space in the muscle tissue of the injection site during the different stages in the process as described in A. C) Reaction scheme including chemical structures of N3-Cy5-WGA, Cy7-DBCO, and Cy7-Cy5-WGA.

