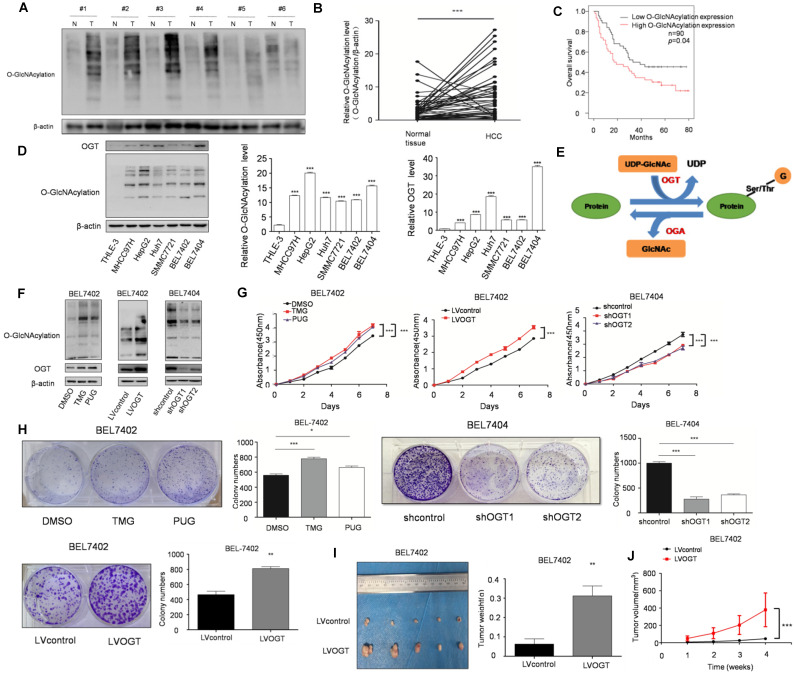
Figure 3.
SIX1 promotes HCC proliferation by regulating O-GlcNAcylation. A The level of total O‐GlcNAcylation was analyzed in paired HCC specimens and their peritumoral tissues by western blot. B Quantitative analysis of O‐GlcNAcylation expression in paired HCC tumor tissues and normal tissues. C Overall survival (OS) curve of HCC patients in correlation with expression of O-GlcNAcylation was analyzed using the IHC scores of a tissue microarray analysis (n=90). D Western blot and quantitative analysis of O-GlcNAcylation expression using a panel of HCC cell lines and the immortal liver cell line THLE3. E Schematic diagram of O-GlcNAcylation. F O-GlcNAcylation expression of BEL7402 or BEL7404 cells upon modification of O-GlcNAcylation using OGA inhibitors (TMG and PUGNAc) or OGT lentivirus was measured. G and H Analysis of cell growth using CCK-8 (G) and colony formation (H) assay upon modification of O-GlcNAcylation using OGA inhibitors (TMG and PUGNAc) or OGT lentivirus. I Tumors weights of nude mice were measured after four weeks at the experimental endpoint. J Plot of tumor volumes in nude mice measured every week. (The data from B, H (down panel) and I were analyzed by Student's t-test, data from H (up panel) and D were analyzed by one-way ANOVA and data from G and J were analyzed by two-way ANOVA.*p < 0.05, **p < 0.01, ***p < 0.001).

