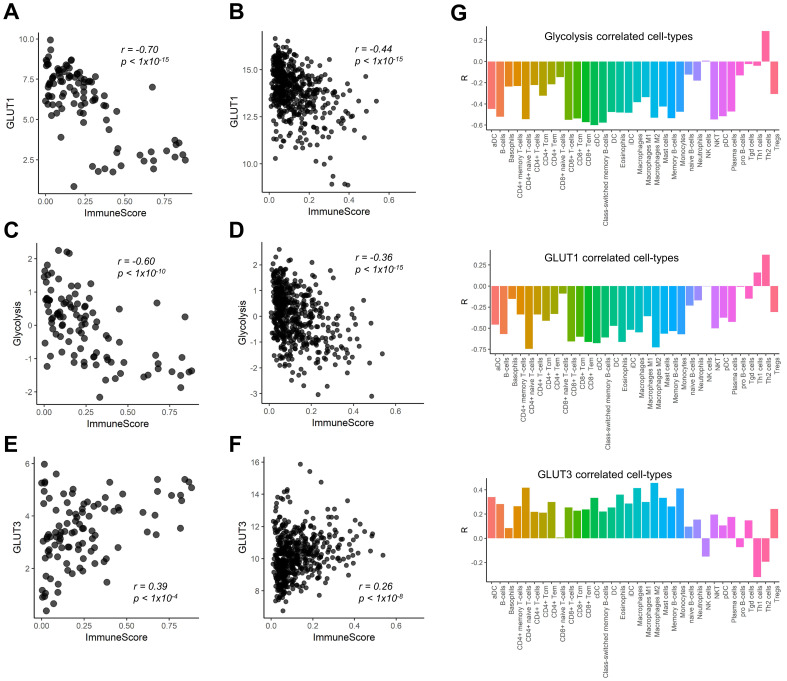
Figure 1.
Correlation of immune cell enrichment score with glucose transporters and glycolysis enrichment score. The overall immune enrichment score (ImmuneScore) was estimated from the RNA-sequencing data, glycolysis enrichment score was estimated by single sample gene set enrichment analysis from RNA-sequencing data of human lung squamous cell carcinoma. (A, B) The expression level of glucose transporter 1 (GLUT1) showed significant negative correlation with ImmuneScore in our study cohort (r = -0.70, p < 0.001) (A) as well as TCGA cohort (r = -0.44, p < 0.001) (B). (C, D) The association between glycolysis enrichment score and ImmuneScore was similar to that of GLUT1 (r = -0.60, p < 0.001 in our study cohort; r = -0.36, p < 0.001 in TCGA cohort). (E, F) On the contrary, the expression level of GLUT3 showed significant positive correlation (r = 0.39, p < 0.001) in our study cohort (E) and in TCGA cohort (r = 0.26, p < 0.001) (F). (G) The enrichment score of each immune cell subtype of tumor microenvironment (TME) showed that most immune cell subtypes showed a significant negative correlation with GLUT1 expression level and glycolysis enrichment score. However, the enrichment scores of most cell subtypes in TME showed a significant positive correlation with GLUT3 expression.

