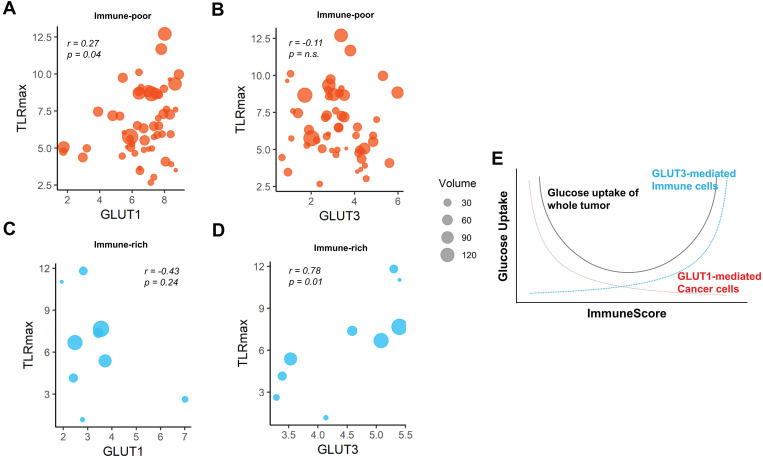
Figure 4.
The pattern of association between TLRmax and glucose transporters were different according to the subgroups based on ImmuneScore. (A) In the immune-poor group, GLUT1 expression showed a positive correlation with TLRmax (r = 0.27, p = 0.04). (B) However, TLRmax showed no correlation with GLUT3 expression in the immune-poor group (r = -0.11, p = n.s.). (C) In immune-rich group, GLUT1 showed a trend of negative correlation with TLRmax, though it did not reach a statistical significance (r = -0.43, p = 0.24). (D) GLUT3 showed a significant positive correlation with TLRmax (r = 0.78, p = 0.01). (E) We propose the association of glucose uptake with immune profiles in TME based on the reciprocal change of glucose metabolism between cancer and immune cells. A schematic diagram shows the overall glucose uptake of tumors mediated by different GLUTs of cancer and immune cells within TME in accordance with the ImmuneScore.

