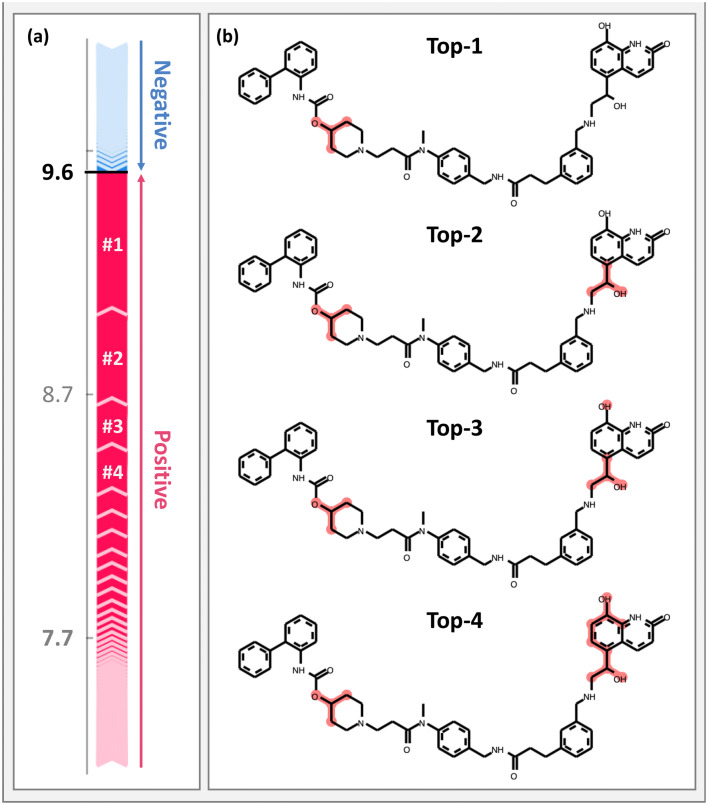
Fig. 2.
Interpretation of GB-based compound potency prediction. a For an exemplary prediction, a feature importance ranking is shown including features with positive (red) and negative (blue) contributions to the prediction of the high potency value. Sequential arrows on the left are proportional to the feature contributions or SHAP values (shown on the pKi scale). The summation of the expected value (7.7, gray) and all feature contributions yield the predicted pKi value (9.6). Numbers in white preceded by # indicate top-ranked features. b From the top to the bottom, top-ranked features with positive contributions are iteratively mapped onto the test compound

