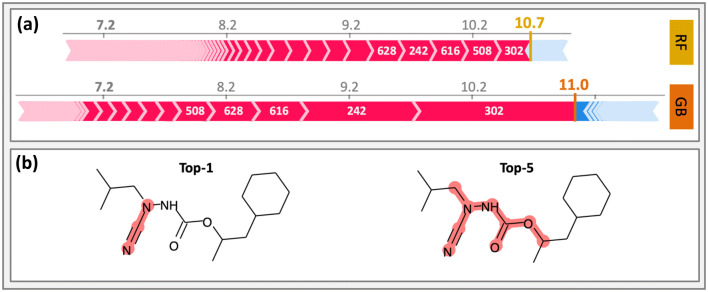
Fig. 4.
Comparative interpretation of RF- and GBM-based potency prediction. In a, positive (red) and negative (blue) feature contributions are compared for RF- and GBM-based regression models. The predicted pKi values are shown in bold and different colors for RF (yellow) and GBM (orange). White numbers give indices of top-ranked features. b The top-1 and top-5 ranked features are mapped onto the compound. These features are common to both models

