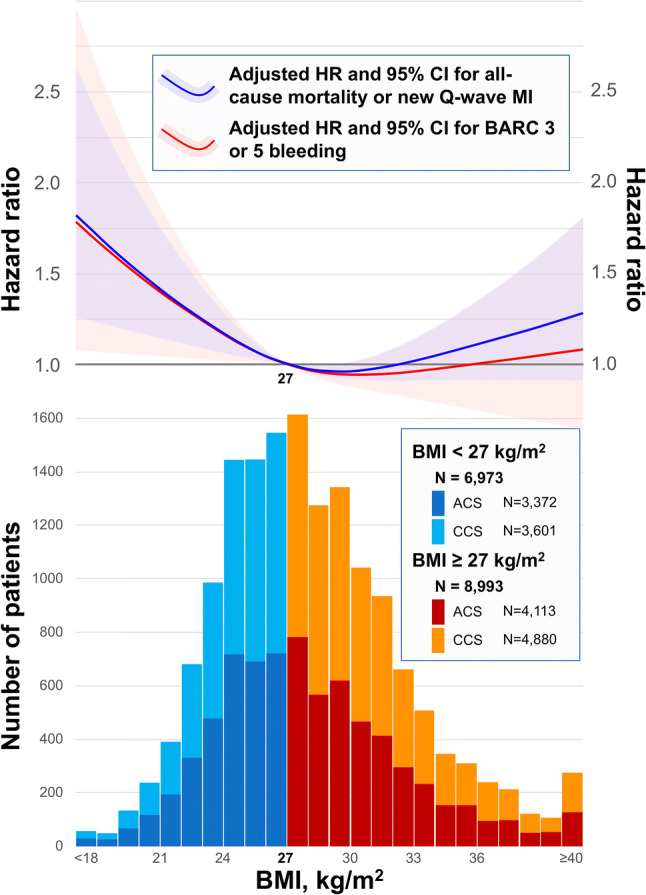
Fig. 2.

Histogram of BMI stratified by clinical presentation with adjusted hazard ratio for adverse events according to BMI. Blue and red bar graphs indicate the number of patients with BMI < 27 kg/m2 and ≥ 27 kg/m2 in the setting of ACS, respectively. Similarly, sky blue and orange bar graphs indicate the number of patients with BMI < 27 kg/m2 and ≥ 27 kg/m2 in the setting of CCS, respectively. Blue curve with light blue area indicates adjusted hazard ratio with 95% CI for composite of all-cause mortality and new Q-wave MI at 2-year according to BMI with reference of 27 kg/m2. Red curve with light red area indicates adjusted hazard ratio with 95% CI for BARC type 3 or 5 bleeding according to BMI with reference of 27 kg/m2. The number of knots for the cubic spline curves were three in each model. Adjusted covariates for all-cause mortality or new Q-wave MI are age (years), sex, clinical presentation (ACS or CCS), diabetes mellitus, hypertension, hypercholesteremia, PVD, COPD, renal impairment, previous MI, previous PCI, and previous CABG. Adjusted covariates for BARC type 3 or 5 bleeding are age (years), sex, clinical presentation (ACS or CCS), diabetes mellitus, previous bleeding, renal impairment, anemia according to WHO classification, and radial access in the index procedure. BMI body mass index, ACS acute coronary syndromes, CCS chronic coronary syndromes, HR hazard ratio, CI confidence interval, MI myocardial infarction, BARC Bleeding Academic Research Consortium, PVD peripheral vascular disease, COPD chronic obstructive pulmonary disease, PCI percutaneous coronary intervention, CABG coronary artery bypass graft, WHO World Health Organization
