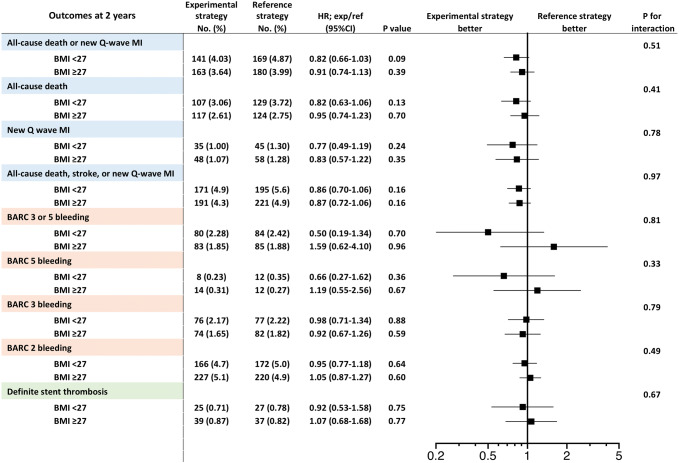
Fig. 3.
Clinical outcomes at 2-year and forest plots in comparison of patients stratified according to BMI with threshold of 27 kg/m2. The squares indicate estimated hazard ratio, and the horizontal lines indicate 95% CI. There was no statistically significant difference in any clinical outcomes between experimental strategy and reference strategy in each BMI group (BMI < 27 kg/m2 or ≥ 27 kg/m2). pinteraction values were derived from Cox regression model. Abbreviations as in Fig. 2

