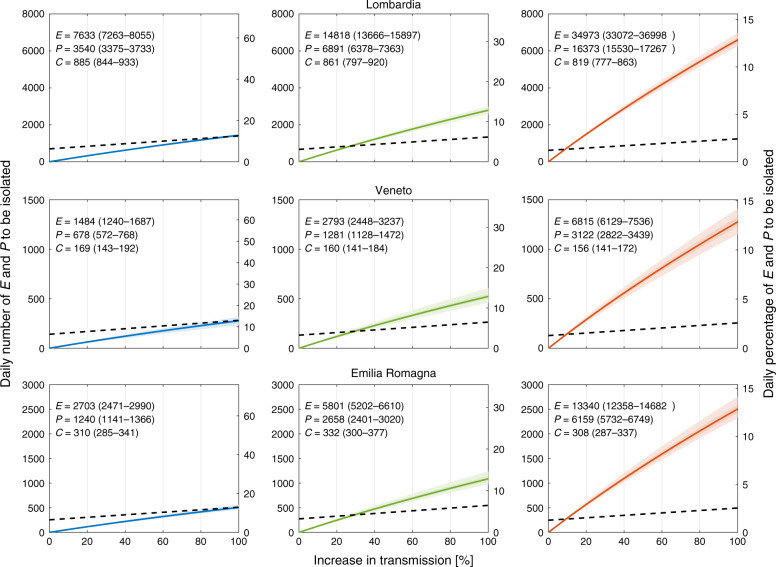
Fig. 4. Charting the isolation efforts required to control COVID-19 in Italy.
Daily number (left axis) and daily percentage (right axis) of exposed E and individuals at peak infectivity, P, to be isolated daily to maintain the epidemic trajectory onto the blue curve in Fig. 2 (corresponding to the baseline scenario) despite the possible increase in transmission induced by the actual release of restrictions (horizontal axes). Different columns refer to different values of the symptomatic fraction σ: 50% (left, blue), 25% (center, green), and 10% (right, red). Solid lines refer to median values, shaded areas to the 95% (lighter shade), and 50% confidence intervals. In each panel, median and 95% confidence interval of E, P and new daily symptomatic cases (C) are given (estimates refer to May 4). The dashed black lines indicate the estimated number of E and P individuals that can be isolated by tracing all the infections generated by the new daily symptomatic cases. The other Italian regions are shown in Supplementary Figs. 4, 5, and 6.

