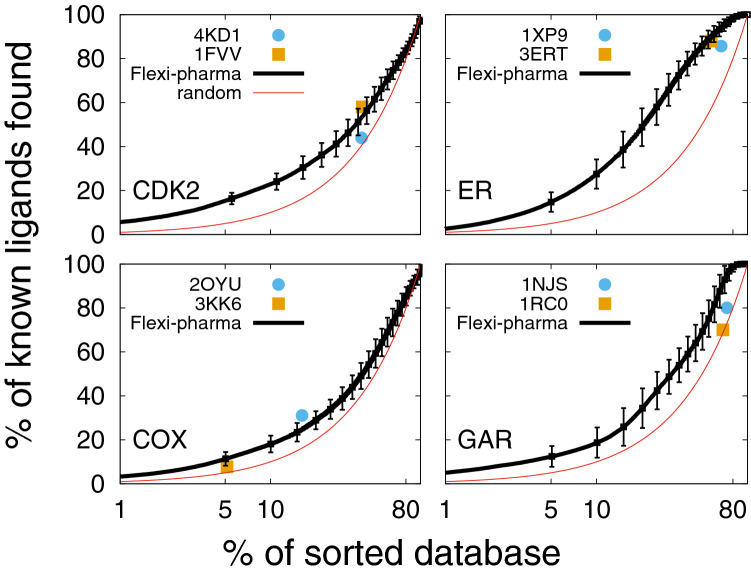
Fig. 3.
Average enrichment plot obtained after applying Flexi-pharma over four benchmark systems (black curves). For each benchmark system, two starting structures (4KD1 and 1FVV for CDK2; 1XP9 and 3ERT for ER; 2OYU and 3KK6 for COX and 1NJS and 1RC0 for GAR) were used. The MD simulations were 10 ns long, and for each starting conformation they were triplicated by assigning random initial velocities (i.e., 6 MD trajectories for each system). From each trajectory 100 equidistant frames were selected, and the Flexi-pharma protocol was applied. The list of votes is used to calculate the EPs. Bootstrapping analysis was performed by sampling with replacement 100 times to obtain the average EP and standard deviation. The Flexi-pharma protocol was applied using a grid-percentage threshold value of 0.7%. The point corresponds to the % of molecules filtered versus the % of ligands found by applying the protocol only using the crystallographic structure. We note that there are two crystal structures for each system. The x-axis is in logarithmic scale

