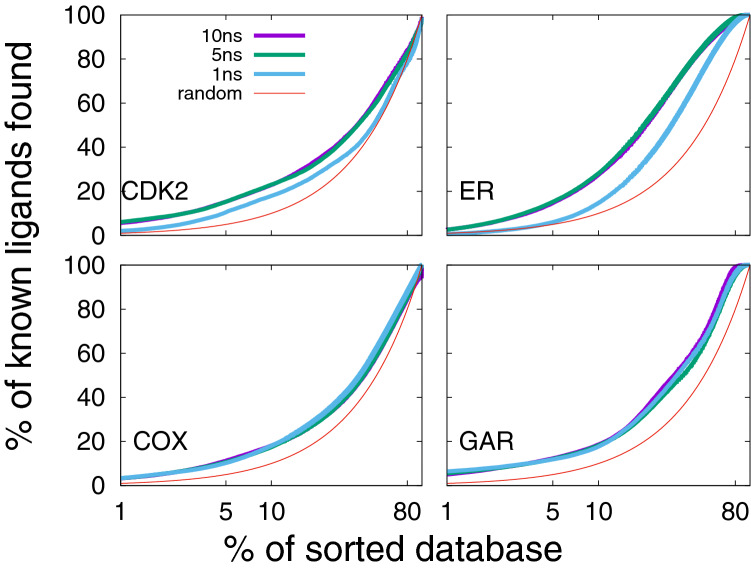
Fig. 7.
Average enrichment plot obtained after applying Flexi-pharma over the four benchmark systems using MD simulations of different length: 10, 5 and 1 ns. For each individual MD trajectory, 100 equidistant frames were selected. Bootstrapping was used to calculate average EPs for 6 replicas starting from two crystal structures of each system. The Flexi-pharma protocol was applied using a grid-percentage threshold value of 0.7%. The x-axis is in logarithmic scale

