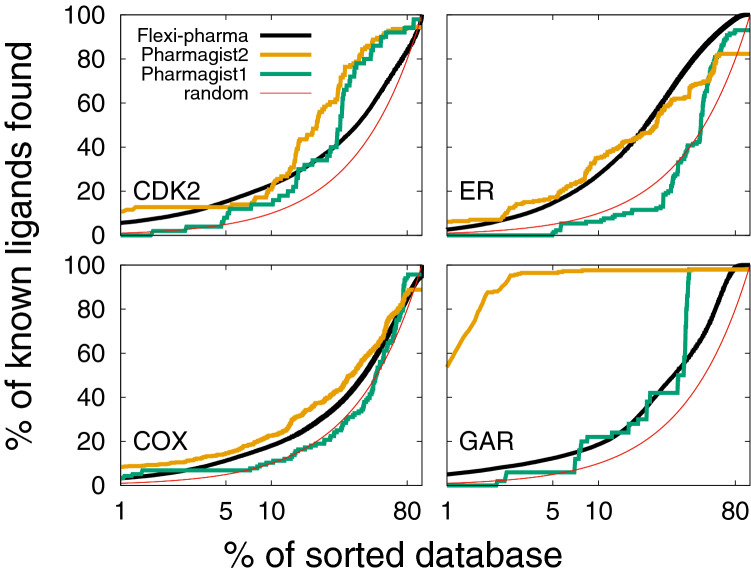
Fig. 8.
Comparison between EPs obtained with Flexi-pharma and Pharmagist [62, 63]. The average enrichment plot obtained after the application of the Flexi-pharma to four benchmark systems (using 10ns, 100 frames of MD and threshold=0.7%) is showed as a black line. The green line is the EP obtained with Pharmagist using as templates three ligands which were not included in the compound library (set 1). The orange line corresponds to the EP obtained with Pharmagist (set 2), when the pharmacophores were generated using the two ligands from the two crystallographic structures (for each system) and one ligand chosen randomly from the compound library. The third ligand was chosen randomly 5 times to obtain an average EP for Pharmagist set 2

